Escape from music subscription services

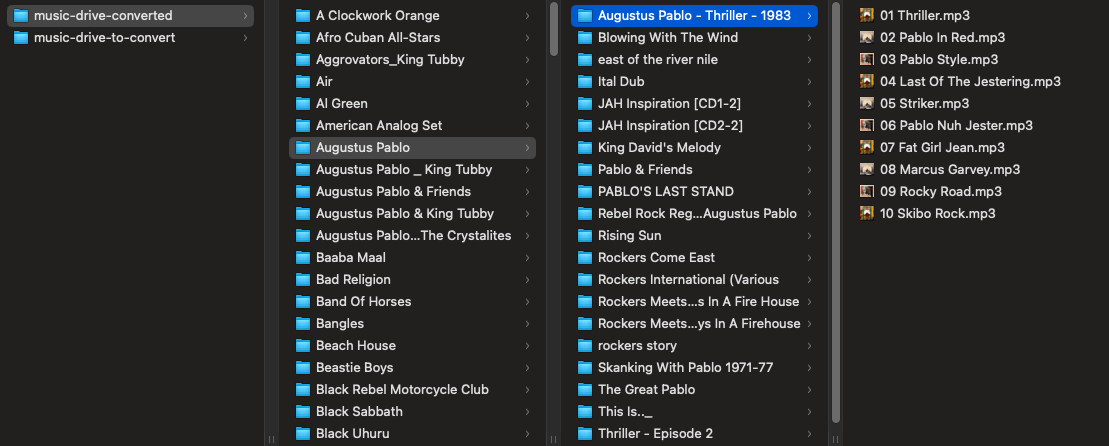
Like the rest of the world, I’ve moved on from CDs for music. However, since I’ve converted all my discs to digital format, and I’m not likely to pay for a smartphone that can hold 140 GB of audio, my music collection has only received attention while I’m bleeding MTB brakes in my garage. Since I recently upgraded my radio in my car to a Boss Carplay radio, which supports loading media from a thumb drive, I decided to try to revive my old tunes.

The first issue is that while the Boss Radio BE7ACP.WX (an upgrade from the original BE920WCPA I purchased, and had to warranty once for the screen flashing on and off repeatedly, and another time for the screen information appearing completely upside down!) only supports MP3 files (and a thumb drive formatted with FAT32 with a max size of 32 GB!~). No problem, this can be done with FFMPEG…

However, what if you have 140 GB of music, with a folder for each artist, and inside that, a folder for each album?

Thus I share this project github.com/omundy/convert-music-library, which will convert an entire iTunes (or other) music library from .m4a to .mp3 (or .wav), maintaining the original directory structure (Artist/Album/Song). It still requires FFMPEG, and Node, but it may help someone else out there avoid locking themselves into a stupid subscription service. Enjoy!

Upcoming workshop at FSU, “I Know Where Your Cat Lives”: The Process of Mapping Big Data for Inconspicuous Trends

I’m doing a workshop / lecture as part of the ongoing Digital Scholars digital humanities discussion group here at Florida State University. Workshop is free and open to the public.

Wednesday, March 25, 2:00-3:30 pm
Fine Arts Building (FAB) 320A [530 W. Call St. map]

Screen Shot 2014-10-29 at 4.32.37 PM

“I Know Where Your Cat Lives”: The Process of Mapping Big Data for Inconspicuous Trends

Big Data culture has its supporters and its skeptics, but it can have critical or aesthetic value even for those who are ambivalent. How is it possible, for example, to consider data as more than information — as the performance of particular behaviors, the practice of communal ideals, and the ethic motivating new media displays? Professor Owen Mundy from FSU’s College of Fine Arts invites us to take up these questions in a guided exploration of works of art that will highlight what he calls “inconspicuous trends.” Using the “I Know Where Your Cat Lives” project as a starting point, Professor Mundy will introduce us to the technical and design process for mapping big data in projects such as this one, showing us the various APIs (Application Program Interfaces) that are constructed to support them and considering the various ways we might want to visualize their results.

This session offers a hands-on demonstration and is designed with a low barrier of entry in mind. For those completely unfamiliar with APIs, this session will serve as a useful introduction, as Professor Mundy will walk us through the process of connecting to and retrieving live social media data from the Instagram API and rendering it using the Google Maps API. Participants should not worry if they do not have expertise in big data projects or are still learning the associated vocabulary. We come together to learn together, and all levels of skill will be accommodated, as will all attitudes and leanings. Desktop computers are installed in FAB 320A, but participants are welcome to bring their own laptops and wireless devices.

Participants are encouraged to read the following in advance of the meeting:

and to browse the following resources for press on Mundy’s project:

For further (future) reading:

I Know Where Your Cat Lives launched

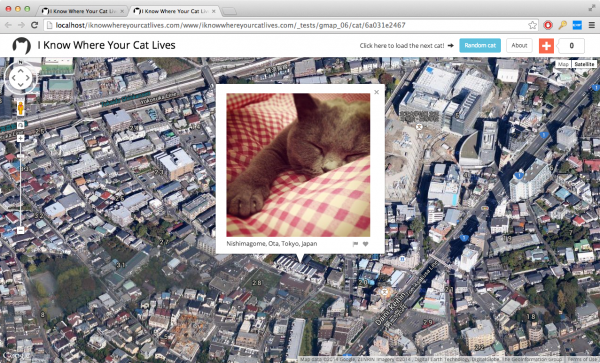
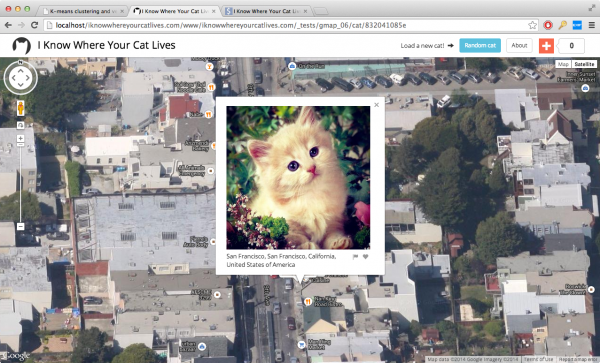
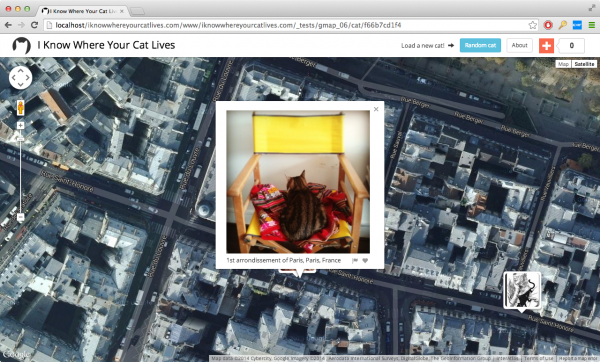
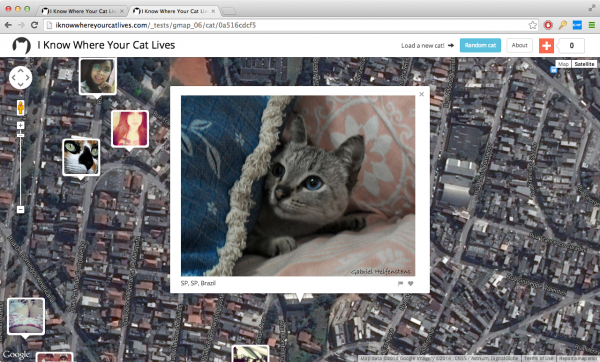
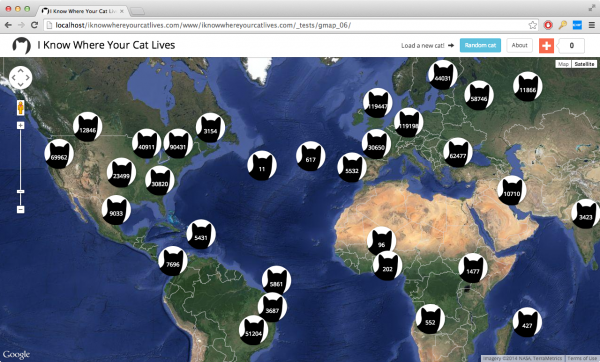
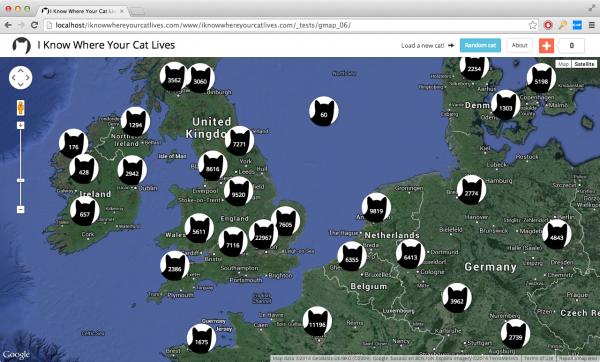
I just launched a new ongoing project this week. Here’s the text, a video and some screenshots. I’ll post more about how I made it soon.

Welcome to the today’s internet—you can buy anything, every website is tracking your every move, and anywhere you look you find videos and images of cats. Currently, there are 15 million images tagged with the word “cat” on public image hosting sites, and daily thousands more are uploaded from unlimited positions on the globe.

“I Know Where Your Cat Lives” iknowwhereyourcatlives.com is a data experiment that visualizes a sample of 1 million public pics of cats on a world map, locating them by the latitude and longitude coordinates embedded in their metadata. The cats were accessed via publicly available APIs provided by popular photo sharing websites. The photos were then run through various clustering algorithms using a supercomputer at Florida State University in order to represent the enormity of the data source.

This project explores two uses of the internet: the sociable and humorous appreciation of domesticated felines, and the status quo of personal data usage by startups and international megacorps who are riding the wave of decreased privacy for all. This website doesn’t visualize all of the cats on the net, only the ones that allow you to track where their owners have been.

Folks can also contribute to a kickstarter to help with hosting costs.

Screen Shot 2014-05-14 at 11.01.20 PM

Screen Shot 2014-05-14 at 11.06.09 PM

Screen Shot 2014-05-15 at 10.16.42 AM

Screen Shot 2014-05-23 at 8.48.02 PM

Screen Shot 2014-05-23 at 9.24.59 PM

Screen Shot 2014-06-05 at 10.28.53 AM

Screen Shot 2014-06-05 at 10.30.26 AM

Term vs. Term for Digital Public Library of America hackathon

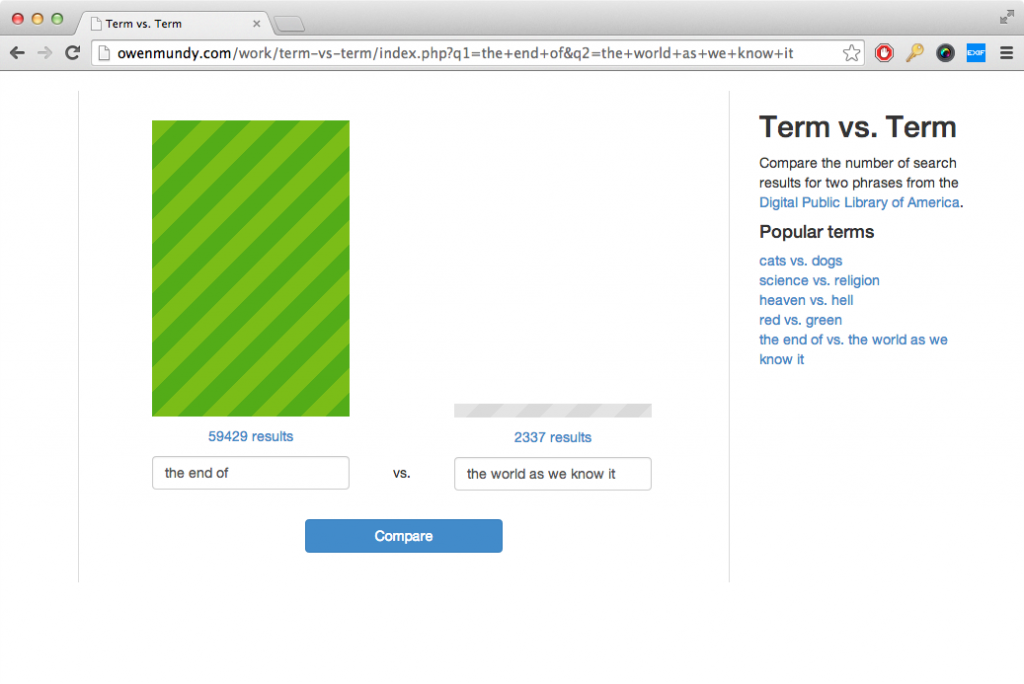
I made a small app to compare the number of search results for two phrases from the Digital Public Library of America for a hackathon / workshop here at Florida State next week.

http://owenmundy.com/work/term-vs-term

dpla term vs term

Digital Humanities Hackathon II – Digital Public Library of America

Monday, April 21, 2:00-3:30 p.m.
Strozier Library, Scholars Commons Instructional Classroom [MAP]

The Digital Scholars Reading and Discussion Group will simulate its second “hackathon” on April 21, allowing participants to learn more about the back-end structure of the Digital Public Library of America. With its April 2013 launch, the DPLA became the first all-digital library that aggregates metadata from collections across the country, making them available from a single point of access. The DPLA describes itself as a freely available, web-based platform for digitized cultural heritage projects as well as a portal that connects students, teachers, scholars, and the public to library resources occurring on other platforms.

From a critical point of view, the DPLA simultaneously relies on and disrupts the principles of location and containment, making its infrastructure somewhat interesting to observe.

In this session, we will visit the DPLA’s Application Programming Interface (API) codex to observe some of the standards that contributed to its construction. We will consider how APIs function, how and why to use them, and who might access their metadata and for what purposes. For those completely unfamiliar with APIs, this session will serve as a useful introduction, as well as a demonstration of why a digital library might also want to serve as an online portal. For those more familiar with APIs, this session will serve as an opportunity to try on different tasks using the metadata that the DPLA aggregates from collections across the country.

At this particular session, we are pleased to be joined by Owen Mundy from FSU Department of Art and Richard Urban from FSU College of Communication and Information, who have considered different aspects of working with APIs for projects such as the DPLA, including visualization and graphics scripting, and developing collections dashboards.

As before, the session is designed with a low barrier of entry in mind, so participants should not worry if they do not have programming expertise or are still learning the vocabulary associated with open-source projects. We come together to learn together, and all levels of skill are accommodated, as are all attitudes and leanings.

Participants are encouraged to explore the Digital Public Library of America site prior to our meeting and to familiarize themselves with the history of the project. Laptops will be available for checkout, but attendees are encouraged to bring their own.

After Douglas Davis – The World’s First Collaborative Sentence

Screen Shot 2013-09-05 at 3.21.58 PM

README for After Douglas Davis
==============================

Statement
————–

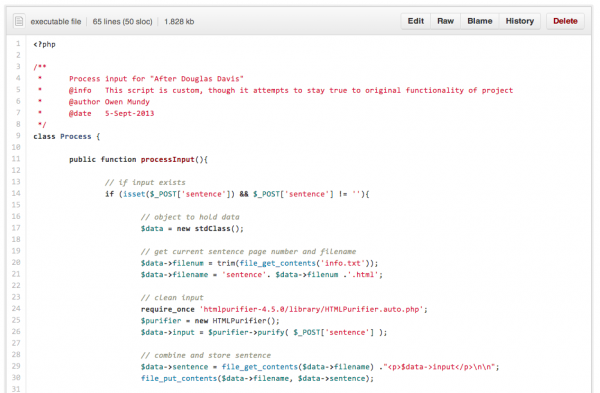
The World’s First Collaborative Sentence was created by Douglas Davis in 1994 and donated to the Whitney Museum of American Art in 1995. Much like today’s blog environments and methods for crowdsourcing knowledge, it allowed users to contribute practically any text or markup to a never-ending sentence with no limits on speech or length.

At some point the sentence stopped functioning, and in early 2012 the Whitney Museum undertook a “preservation effort” to repair and relaunch the project. Measures were taken during the “restoration” to stay true to the original intent of the artist, leaving dead links and the original code in place.

During the preservation the curators placed small sections of garbled ASCII text from the project on Github with the hope that others would “fork” the data and repair the original. However, the Whitney Museum did not succeed in realizing that the collaborative culture of the net Davis predicted has actually arrived. This is evident not only through sites like Wikipedia, Facebook, and Tumblr, but the open source movement, which brings us Linux, Apache, and PHP, the very technologies used to view this page, as well as others like Firefox, Arduino, Processing, and many more.

In the spirit of open source software and artists like Duchamp, Levine, runme.org and Mandiberg, on September 5, 2013, I “forked” Douglas Davis’ Collaborative Sentence by downloading all pages and constructing from scratch the functional code which drives the project. I have now placed this work on Github with the following changes:

1. All pages are updated to HTML5 and UTF-8 character encoding
2. The functional code was rewritten from scratch including a script to remove malicious code
3. The addition of this statement

I was originally disappointed the Whitney Museum didn’t place the full source code in the public domain. What better way to make it possible for artists and programmers to extend the life of Davis’ project by learning from, reusing, and improving the original code than to open source this work? Though, possibly like Davis, my motivation is largely in part an interest in constructing a space for dialog, framing distinct questions and new possibilities, and waiting to see what happens from this gesture.

Included software
————–
HTML Purifier http://htmlpurifier.org/

Live version
————–
Enter After Douglas Davis

About the author
————–
Owen Mundy http://owenmundy.com/

Give Me My Data visualizations / tutorials

I received two separate emails recently sharing images and sample code for visualization projects produced with the help of Give Me My Data. I’m happy to share them both here:

Screen Shot 2013-07-15 at 11.09.27 PM

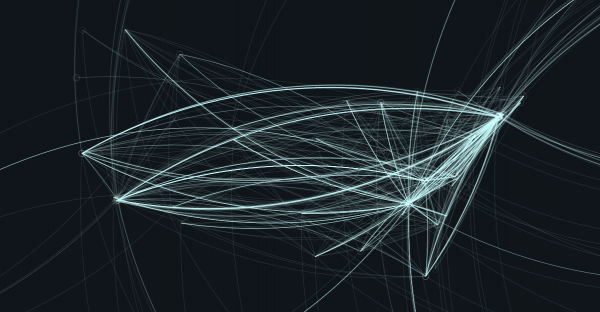
Alex Hornbake posted a visualization mapping Facebook friend locations and connections in D3. You can view it here and there’s a Gist with all the code here. His image shows where his connections are located, or have move to or from. As abstract and beautiful as the image is, one can still make out a rough outline of the United States and even guess at specific cities like Atlanta, New York, Miami, and Los Angeles.

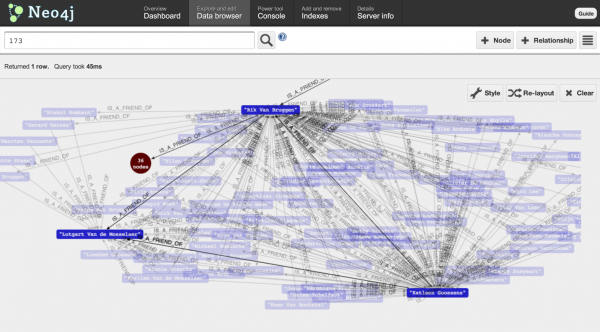
Rik Van Bruggen, of Neo Technology, used the “mutual friends graph” to create an interactive neo4j graph database. Following is more information from the tutorial he produced.

Ever since Facebook promoted its “graph search” methodology, lots of people in our industry have been waking up to the fact that graphs are über-cool. Thanks to the powerful query possibilities, people like Facebook, Twitter, LinkedIn, and let us not forget, Google have been providing us with some of the most amazing technologies. Specifically, the power of the “social network” is tempting many people to get their feet wet, and to start using graph technology. And they should: graphs are fantastic at storing, querying and exploiting social structures, stored in a graph database.

The first step to take was to get access to my own facebook data. Obviously there is the facebook graph api, but I hope that by now you would realise that is just not my cup of tea. Sounded to exhausting :) … So: I found myself a little tool that would allow me to download the data from facebook, in a workable format. Give me my data provides a number of different export options, but I chose the “Mutual Friends Network Graph – as it would give me most info with regards to my actual social network.

png;base64ad8e402bc7ee51e

Use Processing and FFmpeg to export HD video

p_000919

I’ve been trying to find a dependable method for exporting HD video from Processing sketches that contain dynamic data and movement as well as complex 3-dimensional shapes rendered using OpenGL. QuickTime’s screen recording option hogs memory and causes frames to skip, as does does ScreenFlow, my usual go-to for screen recording. The best way I have found so far is to export actual resolution PNG files using “save()” and create an HD video using FFmpeg.

FFmpeg is a very fast video and audio converter that can also grab from a live audio/video sources or create and compress video from multiple still images. It is used from the command line and gives one control of bitrates, codecs, formats, resolution, quality, metadata, and many more options for working with video.

To install FFmpeg with Macports
sudo port install ffmpeg

# view help
ffmpeg -h

# list encoders
ffmpeg -encoders

# list codecs
ffmpeg -codecs

# use format
ffmpeg [global_options] {[input_options] -i ‘input_file’} ... {[output_options] ‘output_file’} ...

# make a movie from matching .png files, write over original, codec = libx264 (H.264), framerate = 30, 1 pass, resolution = 1920×1080, video bitrate = 6Mbits, format = mp4
ffmpeg -y -pattern_type glob -i 'p_*.png' -vcodec libx264 -r 30 -q 100 -pass 1 -s 1920x1080 -vb 6M -threads 0 -f mp4 file.mp4

# convert the video file to Apple ProRes codec for use in Final Cut
ffmpeg -y -i file.mp4 -vcodec prores -vb 6M -r 30 -s 1920x1080 -f mov file.mov

# here’s another example conversion command. this one has a much higher bitrate
ffmpeg -y -i file_01.mp4 -b:v 40M -vcodec libx264 -pass 1 file_02.mp4

For example, using this Processing sketch, you generate the PNG files, and then run the code above on the command line to make this file:

Also see this video for a more detailed example

References

Grid, Sequence Me @ Flashpoint Gallery, Washington D.C.

2013_grid_11_1024w

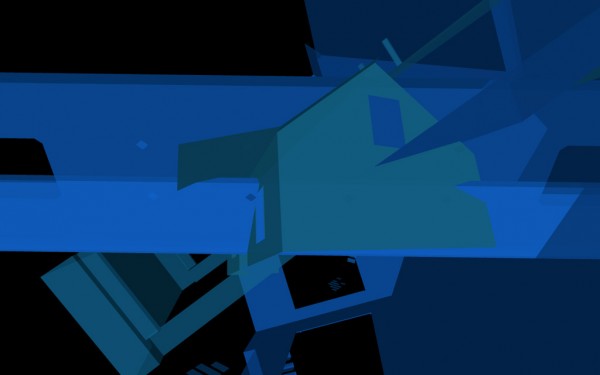
Surrounded by images of cross-sectioned buildings and source code excerpts, gallery visitors encounter fragments of Washington, DC architecture—a vaguely familiar roofline or grid of office windows—remixed with data and source code representing the latest housing sales in the area. Constantly changing, the live data streams into the gallery from both local sources (DC short sale listings) and national (federal policy sites), emphasizing the effects of related micro-macro shifts.

2013_grid_screen_10_1024w

2013_grid_screen_09_1024w

Generated with custom software, these fragments echo financial systems and housing market fluctuations. They mirror mortgages repackaged and sold, titles lost in administrative tape, and dreams confused by legal jargon. Like the complex financial systems of the housing market heyday, the software generates an infinite number of arrangements. The complexity of unique and dynamically-created algorithmic outcomes contrasts with the comforting predictability referenced in the exhibition’s title, “Grid, Sequence Me.”

—Joelle Dietrick and Owen Mundy

2013_grid_01_1024w

2013_sea_screen_23_1024w

2013_sea_screen_20_1024w

2013_sea_screen_13_1024w

2013_sea_screen_06_1024w

Packet Switching, College of Journalism and Communications at the University of Florida

Joelle and have completed our Packet Switching (Weimer Hall) commission in the College of Journalism and Communications at the University of Florida. Read about the process for this project here.

Packet Switching (Weimer Hall), (detail) College of Journalism and Communications, University of Florida, inkjet on polyester on panel, 177.5 ft. x 20.21 ft., 2012; Photograph by Steve Johnson / UF College of Journalism and Communications

Packet Switching (Weimer Hall), (detail) College of Journalism and Communications, University of Florida, inkjet on polyester on panel, 177.5 ft. x 20.21 ft., 2012; Photograph by Steve Johnson / UF College of Journalism and Communications

Packet Switching (Weimer Hall), (detail) College of Journalism and Communications, University of Florida, inkjet on polyester on panel, 177.5 ft. x 20.21 ft., 2012; Photograph by Steve Johnson / UF College of Journalism and Communications

Packet Switching (Weimer Hall), (detail) College of Journalism and Communications, University of Florida, inkjet on polyester on panel, 177.5 ft. x 20.21 ft., 2012; Photograph by Steve Johnson / UF College of Journalism and Communications

Packet Switching (Weimer Hall), (detail) College of Journalism and Communications, University of Florida, inkjet on polyester on panel, 177.5 ft. x 20.21 ft., 2012; Photograph by Steve Johnson / UF College of Journalism and Communications

Packet Switching (Weimer Hall), (detail) College of Journalism and Communications, University of Florida, inkjet on polyester on panel, 177.5 ft. x 20.21 ft., 2012; Photograph by Steve Johnson / UF College of Journalism and Communications

Packet Switching (Weimer Hall), (detail) College of Journalism and Communications, University of Florida, inkjet on polyester on panel, 177.5 ft. x 20.21 ft., 2012; Photograph by Steve Johnson / UF College of Journalism and Communications

Packet Switching (Weimer Hall), (detail) College of Journalism and Communications, University of Florida, inkjet on polyester on panel, 177.5 ft. x 20.21 ft., 2012; Photograph by Steve Johnson / UF College of Journalism and Communications
-->