12 apps to track, share, and visualize personal data

When it comes to personal data everyone’s first concern is usually privacy. But a lot of us want to share our data too, with friends, colleagues, and even complete strangers. While numbers have been used for centuries to improve the way we manufacture and do business, using them to quantify our personal lives is a recent phenomenon.

I’ve been thinking about this because one of my goals in creating Give Me My Data was to inspire others to reuse their data, and respond with images and objects they created. But I’m learning if you don’t know a programming language your choices are somewhat scattered and intimidating.

In a recent email exchange with Nicholas Felton, creator of daytum.com and other quality data products, I asked him what other user data sharing and/or visualization web applications he might have encountered while working on daytum.

Included in this article are the three apps he mentioned with my research plus nine additions of my own. All of the apps I mention help users access their own data to track, share, and/or visualize it either by recording it themselves or exporting it from another software. There’s a table at the end of the article to summarize and compare each.

Give Me My Data givememydata.com free

First, to give some context, Give Me My Data is a Facebook application that helps users export their data out of Facebook for reuse in visualizations, archives, or any possible method of digital storytelling. Data can be exported in common formats like CSV, XML, and JSON as well as customized network graph formats.

Status: operational, in-development

Daytum daytum.com free/$$

And to further contextualize, I’ll also address Daytum, an online app that allows users to collect, categorize, and share personal or other data. You can add any data that can be quantified or written down and organize and display it in many forms including bar and pie charts, plain text, and lists. There’s also a mobile site for quick submissions from your device or you can use their iphone app.

Status: operational, but not currently being developed

Geckoboard geckoboard.com $$

Geckoboard is a hosted real-time status board for all sorts of business (or personal) data. You can view web analytics, CRM, support, infrastructure, project management, etc., in one interface, on your computer or smart phone. To see data from other web services in your “dashboard” you add “widgets”—choose from a large list of APIs, give permissions, configure a variety of options, and see your data in a customized graph. Note though, this service is only for presenting data that is hosted elsewhere, and only in this interface. If you like looking at numbers all day, this is for you.

Status: operational

Track-n-Graph trackngraph.com free/$$

Track, graph, and share any information you can think of: your weight, gas mileage, coffee consumption, anything. The design is a little awkward, the graphs don’t display in Chrome or Safari (Mac), and as far as I can tell there’s no API, but the site seems very useful for storing and making simple graphs of your personal data. There are also various “templates” you can reuse to keep track of data like the Workout Tracker, which has fields for gender and age in addition to minutes you worked out, all of which are important in figuring other data (e.g. calories).

Status: operational

your.flowingdata.com your.flowingdata.com/ free

your.flowingdata lets you record your personal data with Twitter. With it you can collect, interact, customize views, and determine privacy by sending private tweets to your account. This project is created by Nathan Yau who writes Flowing Data and studies statistics at UCSD.
Status: operational, in-development

mycrocosm mycro.media.mit.edu free

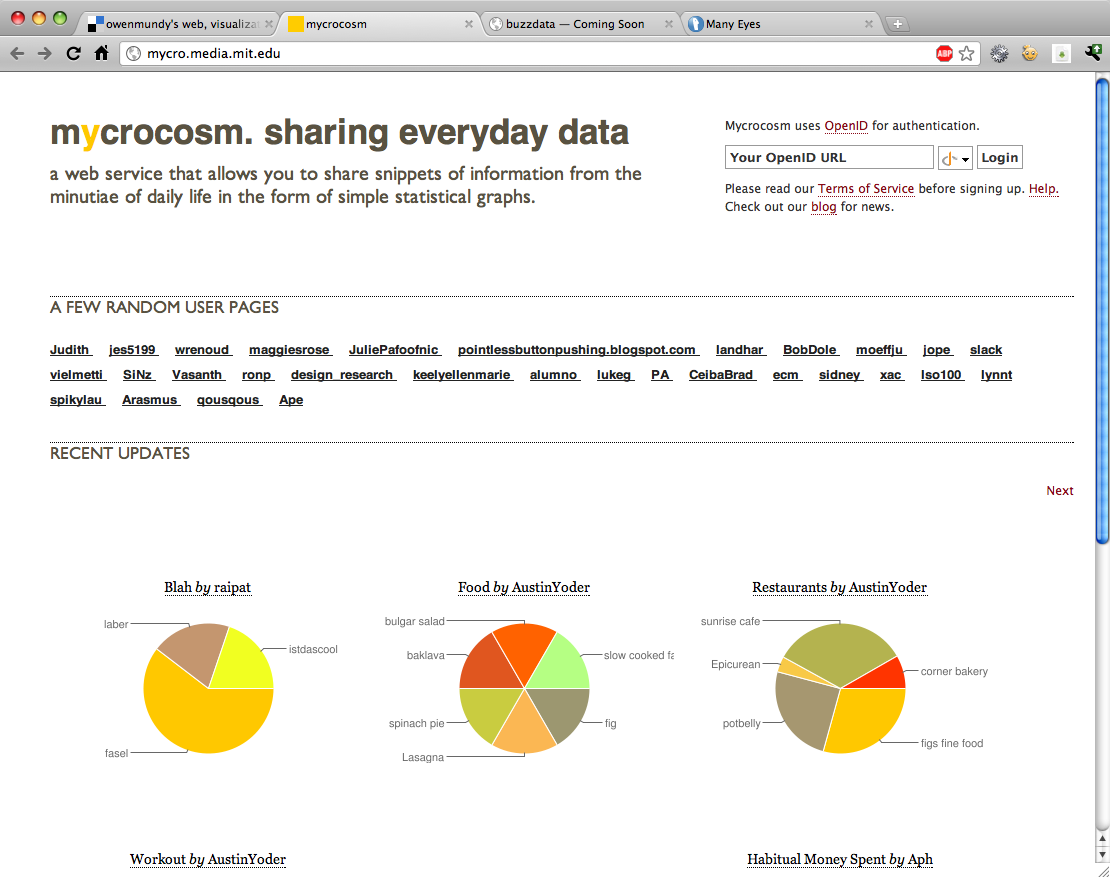
Mycrocosm is a web service that allows you to track and share data and statistical graphs from the minutiae of daily life. Mycrocosm was developed by Yannick Assogba of the Sociable Media Group of the MIT Media Lab.

Status: operational, but not currently being developed

ManyEyes www-958.ibm.com free

ManyEyes is a project by the IBM Research and the IBM Cognos software group. On Many Eyes you can upload your own data and create visualizations, and view, discuss, and rate other’s visualizations and data sets. It is a great concept but it hasn’t evolved much since its original launch. In fact I’m finding the visualization technology has slowly devolved, leaving only about 20% of visualizations actually displaying (Chrome 12.0 on OSX 10.5.8 if folks are reading).

Status: operational

Fitbit fitbit.com $99.95

The Fitbit is a hardware device which tracks your motions and sleep throughout each day. This data can be uploaded and visualized on their website to realize information about your daily activities like calories burned, steps taken, distance traveled and sleep quality. The Fitbit contains a 3D motion sensor like the one found in the Nintendo Wii and plugs into a base station to upload the data.
Status: operational

Personal Google Search History google.com/history free

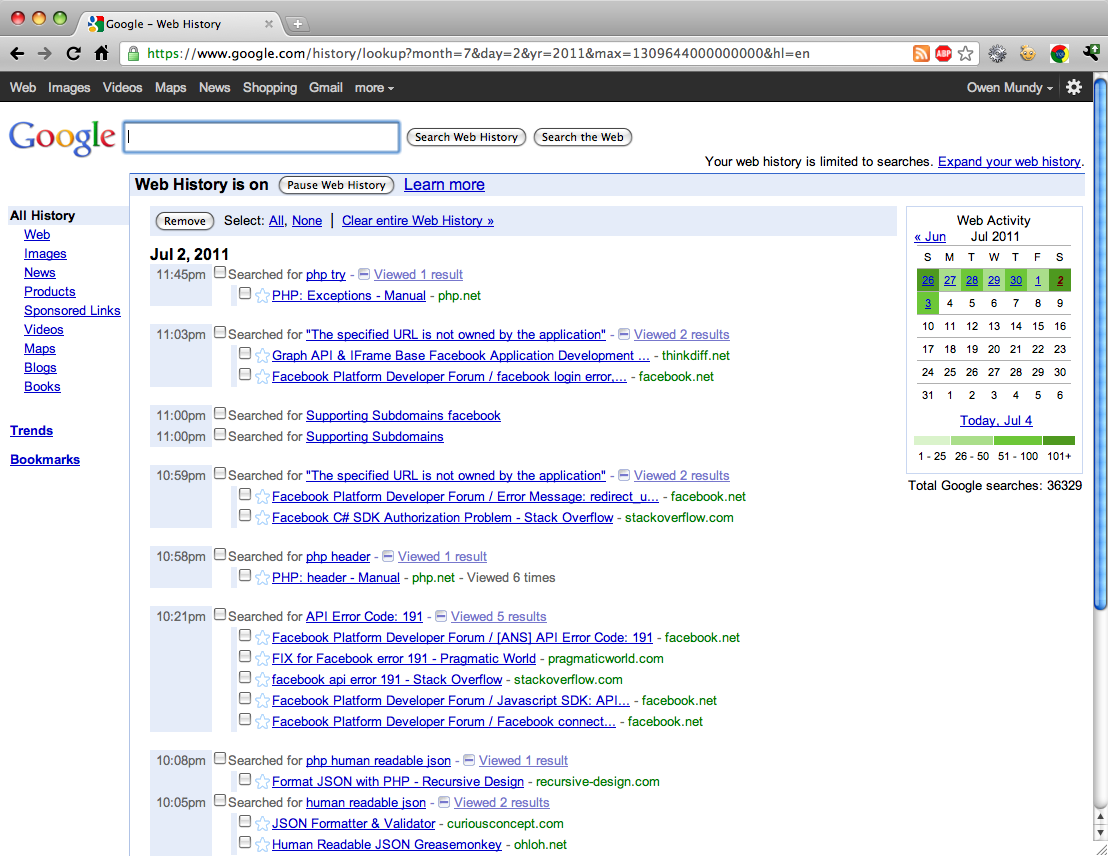
When I first saw this application on the Google site I was immediately alarmed. The amount of data they have collected is staggering; for example, “Total Google searches: 36323.” (since Jan 2006) This is a fantastic picture into the life of a user and what they are reading, watching, responding to. It’s like another, admittedly less manicured version, of Facebook. Instead of creating a profile, I am being profiled.

The privacy implications are serious here, which is probably why you have to login again to view it. It is also why a user’s search history draws the interest of interface artist, Johannes P. Osterhof, who is in the process of exploring the line between private and public data, as well as the even further-evaporated division between surveillance and social networks, in his one-year-long search history-made public project, simply titled, Google.

But, as everyone probably already knows, these big companies are making money and providing services. Google has the resources to take your privacy seriously. Well, kind of, because it mostly doesn’t fit into their business model to not track people.

Status: operational

Google Takeout google.com/takeout free

Speaking of funding, I’m quite impressed by this project. Google Takeout is developed by an engineering team at Google called the Data Liberation Front who take their jobs very seriously. In addition to their Google Takeout project, which allows you to export some of your data from Google, they have a really great website with current information about getting access to the data you store with Google.

Status: operational, in-development

gottaFeeling gottafeeling.com free/$$

gottaFeeling is an iphone application that allows you to track and share your feelings. It’s a simple concept, and while loaded down with a lot of rhetoric, reminds me of the amazing, “We Feel Fine.”

Status: in-development

BuzzData buzzdata.com unsure

Finally, I’ll end with BuzzData, a data-publishing platform that encourages the growth of communities around data. Not yet public, I’ve received a private taste of what this app will do, and it looks like it will be pretty cool. Think a mashup between Github and ManyEyes.

Status: still in-development, not public

So I’ll end with the table I created in my research. There are obviously many more types of ways to keep and manage data that I haven’t addressed here, but this is a good start. For further reading check out the Quantified Self blog/user community/conference created by Gary Wolf, who also authored, The Data-Driven Life, the New York Times article linked above.

track/ upload custom data types visualize publish privacy export mobile upload API price limits

Give Me
My Data

yes yes n/a no yes yes n/a no free none

Daytum

yes yes yes yes $$ yes mobile site and iphone app no free / $4/ month free account limited by amount

Geckoboard

no yes yes no yes no n/a only for viewing $9-$200
/ month
number of users

Track-n-Graph

yes yes yes yes yes no web-based no free / $25 per year free account limited by amount

your. flowingdata

yes yes yes yes yes yes via twitter via twitter free none

mycrocosm

yes yes yes yes yes no web-based email-based free none

ManyEyes

yes yes yes yes no yes no no free none

Buzzdata

yes yes yes yes yes yes email ??? ??? ???

Google Web History

yes n/a yes yes yes yes yes no free none

Google Takeout

yes yes n/a n/a yes yes n/a no free none

Fitbit

yes yes yes yes yes yes yes yes $100 / website is free free web account limited by amount

gottaFeeling

yes no no yes yes no iphone no free none
track/upload Can you track or upload your own data?
custom data types Does the a support custom data types?
visualize Can you create visualizations with the app?
publish Can you publish your data with the software?
privacy Are there options for keeping your data private while using the app?
export Can you export the data back out?
mobile upload Are there options to track or upload data from a device?
API Is there an Application Program Interface that allows you to write code to manage data?
price Is there a free version?
limits What limits are imposed on the free version?

Update: Check out Google Guages and other Google Charts.

Semantic network of hierarchical tags from Camp La Jolla Military Park

A semantic network visualization and detail using tags generated from the hierarchical tagging system I created with Thomas Evan Lecklider as part of my Camp La Jolla Military Park project.

For example this item, Defense Contractors recruit at UCSD Job Fair, in the park is filed under: business » arms industry » spending » recruiting

Give Me My Data 2.0 advances to 2nd round of Rhizome Commission voting

I just learned the Give Me My Data 2.0 proposal I put together with Dr. Phil Steinberg has advanced to the second stage of 2011 Rhizome Commission voting. Give Me My Data 2.0 is an open source web application that exports your user data from any crowdsourcing website in multiple, reusable formats.

I created Give Me My Data while working on Automata, a project which visualizes powerful relationships and which also made it to the second round of the Rhizome Commissions two years ago.

Please VOTE for Give Me Me Data if you are a Rhizome member!

Art Meets Radical Openness + Give Me My Data: A Short History

I’ve just returned from Linz, Austria, where I attended the art and technology festival/conference/exhibition called Art Meets Radical Openness (LiWoLi 2011). It is put on and hosted by Ushi Reiter and others of servus.at, and Martin Kaltenbrunner (creator of Reactable) and others at the Kunst Universität Linz.

While I was here I met a lot of friendly and engaging people, and saw some great works, talks, and performances. I also gave a paper about Give Me My Data, titled, “The Self-Indulgence of Closed Systems.” The presentation was about my current research into historic and contemporary modes of surveillance, ensuing privacy issues, and examples of resistance to these modes of data gathering. It was part the Naked on Pluto lecture series, organized by the cheery Marloes de Valk.

I also conducted a 2-day workshop, “Freedom for Our Files: Creative Reuse of Personal Data,” where I shared information and examples on how to go about data scraping and spidering, reuse and visualization, and using the Facebook API for all of the same, for creative or experimental purposes. I’ve posted some of the code and content from FFOF already.

One important motivation for my attendance was to meet programmers who might be interested in working with me on the more technical aspects of upgrading Give Me My Data to the new Facebook Graph API and finding a way around undocumented data limits imposed by Facebook that my users continue encountering.

Give Me My Data: A Short History

I thought I would give a little bit of a background here, about Give Me My Data, for those interested in its development and other related projects.

In 2008 I finished my Masters of Fine Arts at the University of California, San Diego with a thesis project titled Camp La Jolla Military Park. It was a fictional national park which documented the history and ongoing collaboration between the university with the defense industry. I created a custom content management system (PHP, MySQL, Google Maps API) and formed a group of collaborators to enter data in the system documenting relationships. The project exists now as a series of brochures and website which mimics the national park website and describes the research we conducted. I also gave tours of the “park” (campus) where technology was being developed for defense contractors and other sites with related interest.

The following year, while working during my first year as an assistant professor at Florida State University, I described and began developing aspects of a project I temporarily titled Automata. The project, which was a finalist in 2009 for the Rhizome Commission, proposed to use technology to visualize relationships in which there might exist ethical contradictions, but are difficult to discern for all the actors involved. An example of an ethical contradiction might be collaborations between the defense industry and educational institutions which encourage students to develop technology used to harm other human beings. I proposed to do this through various automated web spiders, semantic analysis, and finally visualizations and other interfaces to the data.

While working on Automata, which was named to reference the automation of the documentation Camp La Jolla performed, I was invited to MIT by Chris Csikszentmihályi, Research Scientist at the MediaLab and Director of Center for Future Civic Media at MIT, to discuss the project with members of his Center for Future Civic Media.

Later in 2009, while planning how I might visualize the network data from Automata, rather than creating the content from scratch I decided to use my Facebook contacts as a test subject. Since there was no application which exported data in various reusable formats, especially one which arranged the contacts into a format which described relationships, I created my own.

This application, live since October 2009, would soon became very popular in its own right. In late April 2010, Facebook made a change to the way they allowed users to present information about themselves. Previously entered user data was suddenly aggregated without permission in order to encourage strangers with common interests to form groups. This slight change in policy caused an uproar within the Facebook community because it attempted to force people together without regard to individual privacy.

Many Facebook users were originally attracted to the site because of its levels of privacy and therefore found this change to be manipulative and deeply disturbing. Further, users were no longer able to access or change this information because it had been incorporated into a larger structure. In their article, Facebook App Brings Back Data, May 1, 2010, The New York Times documented how my application allowed users to regain access to this and other information hidden behind the Facebook interface.

At this time, Facebook (still) did not feature a method to export your data for any purpose. In November 2010, likely influenced by Give Me My Data, Facebook finally added a way for users to export their profile data as a series of HTML pages. I believe their motivation originates in part with my application, and points to the effectiveness of such forms of public art / creative resistance to reach out beyond the art world and contribute to society in lasting ways.

What Now?

So in conclusion, I created Give Me My Data while working on projects related in concept and execution. While I have paused my work on Automata you can see some sitemap visualizations from the project in a series called Firing Blind.

As for the status of Give Me My Data, I developed it using the Facebook REST API, which will be deprecated soon. It uses both REST and FQL (Facebook Query Language) calls to help users access a variety of types and formats of their data. I’m working now to put the project on Github, thereby making the code open source, and also to invite others to help to upgrade the data retrieval method to the Facebook Graph API, and to improve existing code that reformats the data from JSON to XML, CSV, GraphML, Dot, and other popular data formats. Now that I have a handful of business cards and new acquaintances I’m looking forward to moving forward. Please get in touch if you are interested in contributing.

Freedom for Our Files: Code and Slides

A two-day workshop, with both technical hands-on and idea-driven components. Learn to scrape data and reuse public and private information by writing custom code and using the Facebook API. Additionally, we’ll converse and conceptualize ideas to reclaim our data literally and also imagine what is possible with our data once it is ours!

Here are the slides and some of the code samples from the Freedom for Our Files (FFOF) workshop I just did in Linz at Art Meets Radical Openness (LiWoLi 2011).

The first one is a basic scraping demo that uses “find-replace” parsing to change specific words (I’m including examples below the code)

<?php

/*	Basic scraping demo with "find-replace" parsing
 *	Owen Mundy Copyright 2011 GNU/GPL */

$url = "http://www.bbc.co.uk/news/";	// 0. url to start with

$contents = file_get_contents($url);	// 1. get contents of page in a string

					// 2. search and replace contents
$contents = str_replace(		// str_replace(search, replace, string)
			"News",					
			"<b style='background:yellow; color:#000; padding:2px'>LIES</b>",
			$contents);

print $contents;			// 3. print result

?>

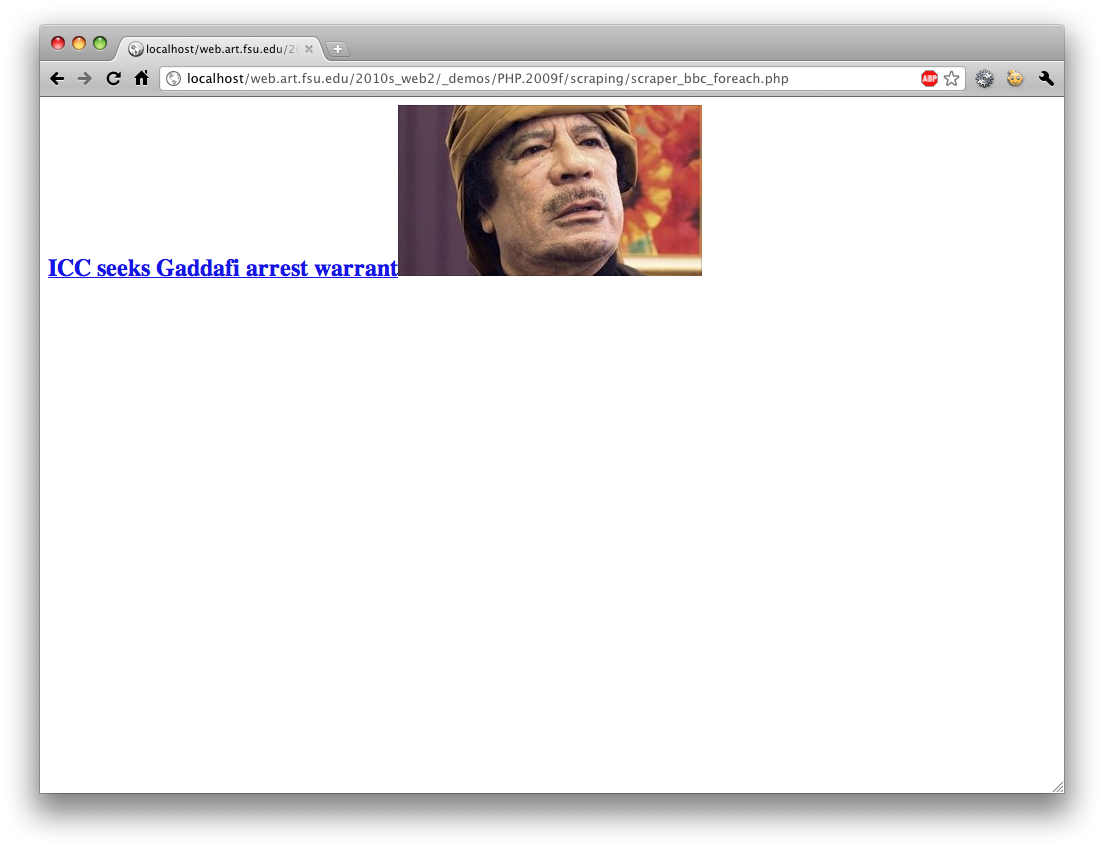
Basic scraping demo with “foreach” parsing

<?php

/*	Basic scraping demo with "foreach" parsing
 *	Owen Mundy Copyright 2011 GNU/GPL */
 
$url = "http://www.bbc.co.uk/news/";	// 0. url to start with

$lines = file($url);			// 1. get contents of url in an array

foreach ($lines as $line_num => $line) 	// 2. loop through each line in page
{		
					// 3. if opening string is found
	if(strpos($line, '<h2 class="top-story-header ">')) 	
	{
		$get_content = true;	// 4. we can start getting content
	}
	
	if($get_content == true)
	{
		$data .= $line . "\n";	// 5. then store content until closing string appears
	}

	if(strpos($line, "</h2>")) 	// 6. if closing HTML element found
	{
		$get_content = false;	// 7. stop getting content
	}
}

print $data;				// 8. print result

?>

Basic scraping demo with “regex” parsing

<?php

/*	Basic scraping demo with "regex" parsing
 *	Owen Mundy Copyright 2011 GNU/GPL */
 
$url = "http://www.bbc.co.uk/news/";		// 0. url to start with

$contents = file_get_contents($url);		// 1. get contents of url in a string
											
						// 2. match title
preg_match('/<title>(.*)<\/title>/i', $contents, $title);

print $title[1];				// 3. print result

?>

Basic scraping demo with “foreach” and “regex” parsing

<?php

/*	Basic scraping demo with "foreach" and "regex" parsing
 *	Owen Mundy Copyright 2011 GNU/GPL */

// url to start
$url = "http://www.bbc.co.uk/news/";

// get contents of url in an array
$lines = file($url);

// look for the string
foreach ($lines as $line_num => $line) 
{	
	// find opening string
	if(strpos($line, '<h2 class="top-story-header ">')) 
	{
		$get_content = true;
	}
	
	// if opening string is found 
	// then print content until closing string appears
	if($get_content == true) 
	{
		$data .= $line . "\n";
	}

	// closing string
	if(strpos($line, "</h2>")) 
	{
		$get_content = false;
	}
}

// use regular expressions to extract only what we need...

// png, jpg, or gif inside a src="..." or src='...' 
$pattern = "/src=[\"']?([^\"']?.*(png|jpg|gif))[\"']?/i";
preg_match_all($pattern, $data, $images);

// text from link
$pattern = "/(<a.*>)(\w.*)(<.*>)/ismU";
preg_match_all($pattern, $data, $text);

// link
$pattern = "/(href=[\"'])(.*?)([\"'])/i";
preg_match_all($pattern, $data, $link);

/* 
// test if you like
print "<pre>";
print_r($images);
print_r($text);
print_r($link);
print "</pre>";
*/

?>

<html>
<head>
<style> 
body { margin:0; } 
.textblock { position:absolute; top:600px; left:0px; }
span { font:5.0em/1.0em Arial, Helvetica, sans-serif; line-height:normal; 
background:url(trans.png); color:#fff; font-weight:bold; padding:5px } 
a { text-decoration:none; color:#900 }
</style>
</head>
<body>
<img src="<?php print $images[1][0] ?>" height="100%"> </div>
<div class="textblock"><span><a href="<?php print "http://www.bbc.co.uk".$link[2][0] ?>"><?php print $text[2][0] ?></a></span><br>
</div>
</body>
</html>

And the example, which presents the same information in a new way…

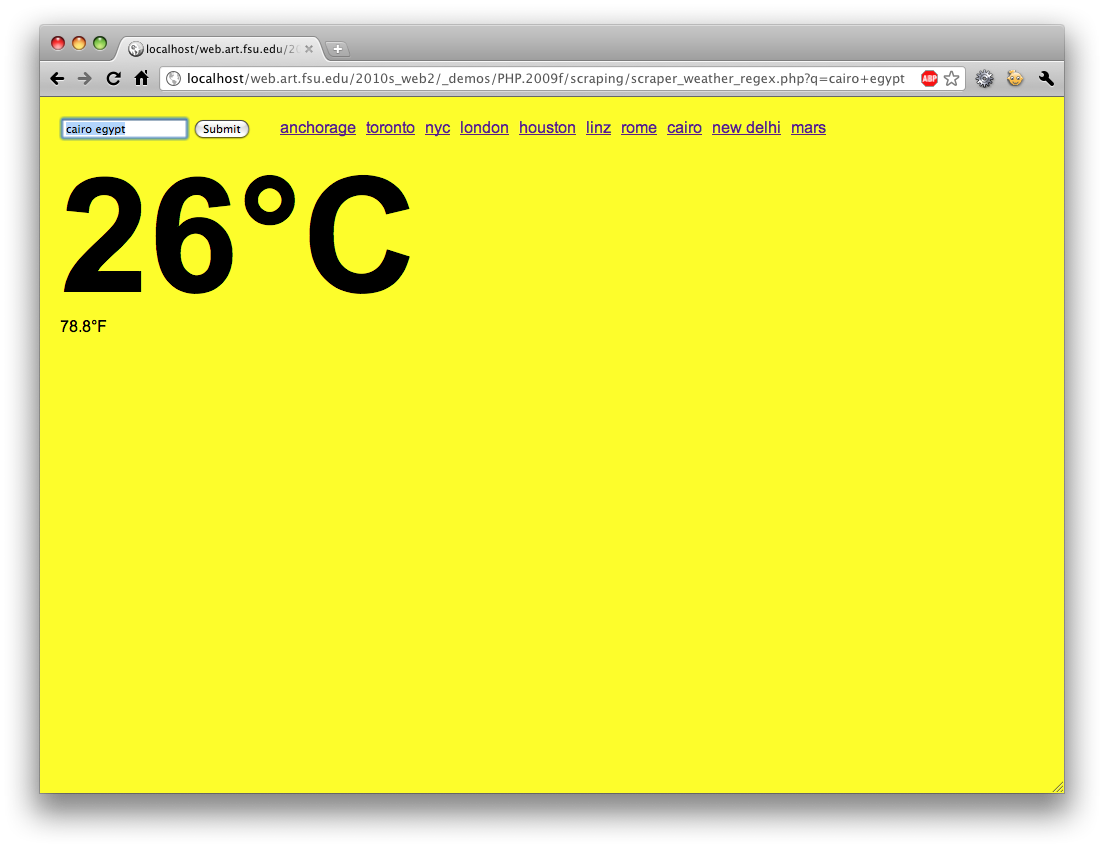
Advanced scraping demo with “regex” parsing. Retrieves current weather in any city and colors the background accordingly. The math below for normalization could use some work.

<?php

/*	Advanced scraping demo with "regex" parsing. Retrieves current 
 * 	weather in any city and colors the background accordingly. 
 *	The math below for normalization could use some work.
 *	Owen Mundy Copyright 2011 GNU/GPL */

?>

<html>
<head>
<style> 
body { margin:20; font:1.0em/1.4em Arial, Helvetica, sans-serif; } 
.text { font:10.0em/1.0em Arial, Helvetica, sans-serif; color:#000; font-weight:bold; } 
.navlist { list-style:none; margin:0; position:absolute; top:20px; left:200px }
.navlist li { float:left; margin-right:10px; }
</style>
</head>

<body onLoad="document.f.q.focus();">

<form method="GET" action="<?php print $_SERVER['PHP_SELF']; ?>" name="f">

	<input type="text" name="q" value="<?php print $_GET['q'] ?>" />
	<input type="submit" />

</form>

<ul class="navlist">
	<li><a href="?q=anchorage+alaska">anchorage</a></li>
	<li><a href="?q=toronto+canada">toronto</a></li>
	<li><a href="?q=new+york+ny">nyc</a></li>
	<li><a href="?q=london+uk">london</a></li>
	<li><a href="?q=houston+texas">houston</a></li>
	<li><a href="?q=linz+austria">linz</a></li>
	<li><a href="?q=rome+italy">rome</a></li>
	<li><a href="?q=cairo+egypt">cairo</a></li>
	<li><a href="?q=new+delhi+india">new delhi</a></li>
	<li><a href="?q=mars">mars</a></li>
</ul>

<?php

// make sure the form has been sent
if (isset($_GET['q']))
{
	// get contents of url in an array
	if ($str = file_get_contents('http://www.google.com/search?q=weather+in+'
						. str_replace(" ","+",$_GET['q'])))
	{
		
		// use regular expressions to extract only what we need...
		
		// 1, 2, or 3 digits followed by any version of the degree symbol 
		$pattern = "/[0-9]{1,3}[º°]C/";
		// match the pattern with a C or with an F
		if (preg_match_all($pattern, $str, $data) > 0)
		{
			$scale = "C";
		}
		else
		{
			$pattern = "/[0-9]{1,3}[º°]F/";
			if (preg_match_all($pattern, $str, $data) > 0)
			{
				$scale = "F";
			}
		}
		
		// remove html
		$temp_str = strip_tags($data[0][0]);
		// remove everything except numbers and points
		$temp = ereg_replace("[^0-9..]", "", $temp_str);
		
		if ($temp)
		{
			
			// what is the scale?
			if ($scale == "C"){
				// convert ºC to ºF
				$tempc = $temp;
				$tempf = ($temp*1.8)+32;
			}
			else if ($scale == "F")
			{
				// convert ºF to ºC
				$tempc = ($temp-32)/1.8;
				$tempf = $temp;
			}
			// normalize the number
			$color = round($tempf/140,1)*10;
			// cool -> warm
			// scale -20 to: 120
			$color_scale = array(
					'0,  0,255',
					'0,128,255',
					'0,255,255',
					'0,255,128',
					'0,255,0',
					'128,255,0',
					'255,255,0',
					'255,128,0',
					'255,  0,0'
					);	
		
?>

<style> body { background:rgb(<?php print $color_scale[$color] ?>) }</style>
<div class="text"><?php print round($tempc,1) ."&deg;C " ?></div>
<?php print round($tempf,1) ?>&deg;F

<?php
		
		}
		else 
		{
			print "city not found";	
		}
	}
}
?>

</body>
</html>


For an xpath tutorial check this page.

For the next part of the workshop we used Give Me My Data to export our information from Facebook in order to revisualize it with Nodebox 1.0, a Python IDE similar to Processing.org. Here’s an example:

Update: Some user images from the workshop. Thanks all who joined!

Mutual friends (using Give Me My Data and Graphviz) by Rob Canning

identi.ca network output (starting from my username (claude) with depth 5, rendered to svg with ‘sfdp’ from graphviz) by Claude Heiland-Allen

Freedom for Our Files: Creative Reuse of Personal Data Workshop at Art Meets Radical Openness in Linz, Austria

This weekend I am presenting a lecture about GIve Me My Data and conducting a two-day data-scraping workshop at Art Meets Radical Openness in Linz, Austria. Here are the details.

The Self-Indulgence of Closed Systems
May 13, 18:45 – 19:15
Part artist lecture, part historical context, Owen Mundy will discuss his Give Me My Data project within the contexts of the history of state surveillance apparatuses, digital media and dialogical art practices, and the ongoing contradiction of privacy and utility in new media.

Freedom for Our Files: Creative Reuse of Personal Data
May 13-14, 14:00 – 16:30
A two-day workshop, with both technical hands-on and idea-driven components. Learn to scrape data and reuse public and private information by writing custom code and using the Facebook API. Additionally, we’ll converse and conceptualize ideas to reclaim our data literally and also imagine what is possible with our data once it is ours! Register here


Art Meets Radical Openness (LiWoLi 2011),
Date: 12th – 14th May 2011
Location: Kunstuniversität Linz, Hauptplatz 8, 4020 Linz, Austria

Observing, comparing, reflecting, imitating, testing, combining

LiWoLi is an open lab and meeting spot for artists, developers and educators using and creating FLOSS (free/libre open source software) and Open Hardware in the artistic and cultural context. LiWoLi is all about sharing skills, code and knowledge within the public domain and discussing the challenges of open practice.

A Single Composite, May 7–June 24, Bauer&Ewald, Berlin

This week I am installing an ambitious new project in a quaint and friendly space called bauer&ewald located in Kreuzberg / Neuköln (Berlin) opening on May 7 until the end of June. There will be a party on the evening of the opening day. Please come if you are in town.

You can see a video of a small study online here and here.

A Single Composite
Owen Mundy

May 7–June 24

Vernissage (opening): May 7, 19:00+
Finissage (closing): June 23, 19:00+

“Nothing now distinguishes the function of the weapon and the eye; the projectile’s image and the image’s projectile form a single composite.”
—Paul Virilio in “War & Cinema”

A Single Composite is a kinetic installation and multi-projection/viewing apparatus consisting of one 100cm wide film strip stretched, twisted, and looped through multiple spaces by reconstituted digital printer chassis. This cinematic enterprise, a sprawling film through which declassified and other found reconnaissance footage is projected on walls, ceilings, and floors, forms a series of individual moments of surveillance and implied violence.

Bauer&Ewald
Lenaustraße 20
12047 Neukölln-Berlin
u8 schönleinstraße, u7/u8 hermannplatz

http://bauerundewald.com

Öffnungszeiten (open hours):
Mo-Sa ab 18:00, So ab 16:00
jeweils bis spätnachts (until late)

Give Me My Data on Today Show’s Digital Life blog

How to back up your Facebook data
By Rosa Golijan

“There are plenty of reasons to back up your Facebook data — maybe you want to archive, reuse, or save it — and it turns out that there’s a simple way to do so. In fact, a few clicks and an app called Give Me My Data will do the trick in seconds.

Give Me My Data is a simple Facebook app with a single purpose — to help you back up your Facebook data so that you can do whatever you wish with it — and it does it well.

All you need to do is add the application, authorize it to access your information, and select how you want to receive your data — options include plain text, CSV, and XML formats — and … that’s it. Give Me My Data will proceed to spit out your details by category — personal information, status updates, links, pages, etc — and then you’re free to do whatever you will with it.

It’s worth noting that Facebook itself provides a way to download most of your data — the link to do so can be found in your account settings — but it doesn’t provide the various formatting options nor the varying breakdowns of data.”

Continue reading