Convert NTSC video to PAL with smooth motion

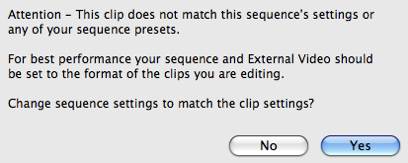
When converting NTSC digital video to PAL the pixel aspect ratio needs to change from 720 x 480 (NTSC) to 720 x 576 (PAL). Depending on your project the more important problem is the transition from 29.97 (NTSC) frames per second to 25 (PAL).

I found Final Cut Pro and QuickTime both convert 29.97 to 25 frames per second by cutting the five extra frames to make it fit. This results in a loss of temporal resolution, making motion in the footage jerk and skip because the frames which created the illusion of motion are missing.

There are a few commercial applications that can convert NTSC to PAL with smooth motion, but I followed advice on this forum which suggested using Compressor for the standards conversion:

  1. Export an NTSC Quicktime movie from Final Cut Pro without compression
  2. In Compressor, select a DV PAL preset
  3. Turn on Frame controls and set resizing and retiming to “better” or “best.”
  4. Run Compressor. This took >3 hours for 12 minutes of uncompressed footage.

This should give you a 720 x 576 (PAL CCIR 601) with 25 frames per second. Finally, in DVD Studio Pro make sure you choose PAL before you import any footage, and leave all the regions selected which is the default.

UNIX: List open files


Can’t eject a CD or unmount an external hard drive on your mac because of this error: The disc is in use and could not be ejected. Try quitting applications and try again.?

This UNIX command reports a list of all open files and applications that opened them. Open Terminal and replace the name of your volume below to test.

$ lsof | grep /Volumes/media/

Thanks

Addendum: Here’s an even more helpful command: eject the disk with UNIX when the GUI won’t allow it.

$ diskutil eject [Mount Point|Disk Identifier|Device Node]

Oh, and a final tip nestled in this addition: If you have a space in the name (for example you had two disks mounted named “backup” and OSX named the second one to mount “backup 1”) then you can easily reference the name (or any file or directory name with a space) with a backslash which “escapes” the character. Typing the first few characters and then type the tab key will do it automatically.

$ diskutil eject /Volumes/backup\ 1/

Network graph grouping: A small art world

This “Mutual friends network graph” created with Nodebox using data I exported with Give Me My Data contains 540 “Facebook friends” and their connections to each other. When the graph renders it attempts to position people who have lots of connections closer together. With this you can see groups unfold based on your own social networks. Since I have spent more time in academia than I have at specific jobs my “clusters” are based mostly on my academic history.

You can also see that there are a lot of connections between my high school and where I did my undergraduate study, which is based on the fact they are located very close to each other, so friends from high school also chose the same university or town to live in. There are also a lot of interconnections between Indiana University where I did my undergrad, the University of California, San Diego, where I did graduate study, and Florida State University, where I teach now. This is probably due to the fact that my connections are all within a given field, in my case visual arts, and points to the often expressed notion that “the art world is actually very small.”

Random Hacks of Kindness (RHoK) and Google Person Finder

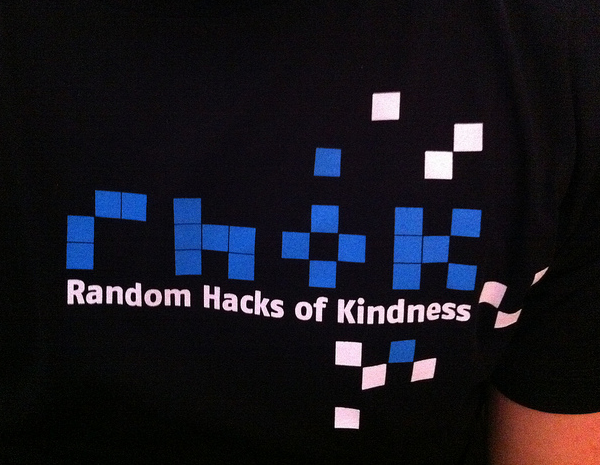
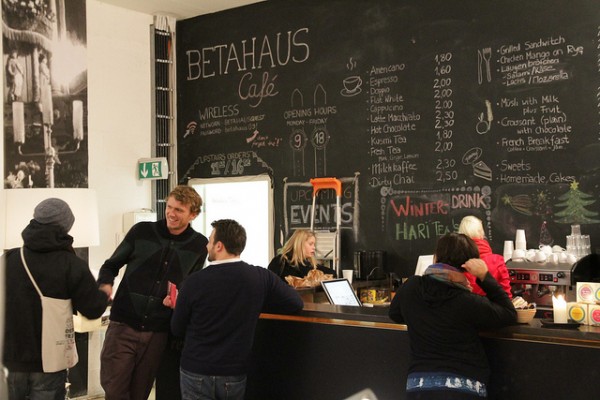
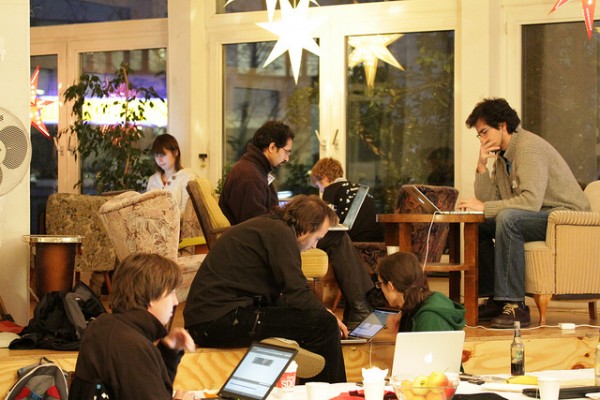
Last weekend I took part in Random Hacks of Kindness an international hackathon dedicated to creating useful systems to respond to critical global challenges. I met with other programmers at the Betahaus in Berlin and worked with Tim Schwartz and Mikkel Gravgaard on Google Person Finder a searchable database of missing persons that helps people find loved ones during disasters. It was used during the 2010 Haiti and Chilean Earthquakes and is developed by volunteers and employees of Google.

Photo by Flickr user rhokberlin

Photo by Flickr user nblr

Photo by Flickr user nblr

Give Me My Data and exporting mutual friends

On the one-year anniversary of the beginning of Give Me My Data I’m very happy to announce that you can now export your friends and your mutual friends from facebook using two new formats. Both of the data formats are geared towards making graphs by displaying objects and their relationships. Needless to say, this is the most often requested feature since the official beta launch in April 2010. See below for more information

The DOT language

DOT is a plain text graph description language and can be rendered using a variety of layout applications like Graphviz or Tulip.

This example (saved as a plain text file with the .dot extension)

graph G
{
	a -- b -- c;
	b -- d;
}

Produces something like this

Python / Nodebox 1.0

The other file format is also for visualizing relationships. You can copy and paste the contents into a plain text file saved with a .py extension and open it in Nodebox, a Mac application that uses Python to create 2D visuals. Learn more about creating graphs in Nodebox.

Here’s an example file. My mutual friends exported from Facebook…

Review of “Python: Visual QuickStart Guide (2nd edition)”

python_vqg_cover

I have to admit I had my doubts about this book. I have not been impressed with Visual QuickStart Guides in the past. I respect the idea, of presenting only essential information in an easy-to-understand introductory manner, but that was rarely the case in previous experiences. Usually I found them to be a mixture of non-essential information that was not presented in a manner that would be good for those new to the subject.

That being said, their Python (2nd edition) breaks with their past. So far, I have almost consistently found it to be concise and to the point regarding an introduction to Python and programming languages in general. The examples are relevant and work accordingly. While I normally head to O’Reilly for the in-depth look at a language, this book is a great starting point.

One note and criticism; The examples using input() are flawed for users with Python <3 (most of us). You have to use raw_input() in place of it, although the book does not point this out.

Germany and Google Street View

This week I have been enjoying the blurred images of German buildings whose owners have chosen to opt-out of Google Street View. Infamous moments in the country’s history have led Germans to take privacy very seriously; especially when it comes to information about their residences. Unlike the United States, where data privacy is an opt-out option, Germany law states that, “citizens must opt-in to have their data collected in any way.” (1). In fact, there is a document detailing the rights of the “data subject” in the German Federal Data Protection Act which serves “to protect the individual against his right to privacy being impaired through the handling of his personal data.”

An even more powerful gesture are the very public images that have resulted from this protection. While they serve a specific function—to obscure identifying aspects of buildings, faces, etc.—they also communicate very effectively the message that individuals should have the right to decide how their data is used. This gets to the heart of the Give Me My Data app—to prompt this sort of discussion. It is then ironic that Google, a company whose revenue is based almost completely on advertising opportunities made possible by aggregating and re-representing data, has inadvertently brought us this message.

I was excited to find my own apartment building in Berlin has been removed.

Another building down the street

Helge Denker, a reporter with the German daily, Das Bild, has found a clever way to opt-out.

Fritzing for designing electronics

I just discovered Fritzing; an application for designing electronic projects and laying-out PCBs. The software is dependable, has a useful website with tutorials and project examples, and they are even starting a fabrication service in Dec 2010. Fritzing was started in August 2007 by the Interaction Design Lab at the University of Applied Sciences Potsdam, Germany.

When you launch the software you begin with a breadboard. Then you drag components from a large list on the right, choosing options for the parts. Adjusting rotation, color, and placement is all fairly intuitive. While I found working with “2.5D” perspective is a little awkward at first, you get used to it. For output, you can select between Breadboard, Schematic, and PCB views on the bottom right.

Here’s a design to accompany a previous sketch, Fading an LED with PWM and a Potentiometer

inSCRIPTion: … text … image … action …

If you are in Los Angeles / Long Beach check out Keyword Intervention at this group show:

inSCRIPTion: … text … image … action …
November 8th – December 9th
Opening Reception: November 9, 2010 (3-7 pm)

Cerritos College Art Gallery
11110 Alondra Blvd
Norwalk, CA

The current ubiquity of transmediated and telepresential dialogues, most notably via the casual and partially-inscriptive technologies of computer-aided chat programs and cell-phone text messaging, certainly complicates the age-old distinction between written and oral communication, and between langue and parole. In part, this conceptual convergence is predicated on the collapsing of linguistic signifiers into the immanent patterns of (un)becomings inherent to computational code. In such an (intra-)active environment, the living fluidity of dialogue is often actualized by digits (a technophenomenological fusion of finger movement and binary language) and the lifeless permanence of inscription can manifest as a dynamic system of inSCRIPTion.

Reveling in the physical and conceptual opacity of words, the fourteen contemporary artists participating in inSCRIPTion at the Cerritos College Art Gallery, in aiming for a field of matrixial encounters, produce materialized event-scores that hover somewhere between notation and realization and which play games with language through transplantation into various deviant contexts. Some of the diverse multi-media works in the exhibition demand that the artist and/or viewer perform an action, while others emphasize the creative and performative act of reading itself. Still others contain moving, as opposed to static, text and/or process found language through a scripted algorithm. The end results of these (re)visualized schemas include readymade actions, speaking objects, and literal semiotic machines that nevertheless remain discursively framed, which is not to say trapped, by the nationalist, racial, gendered, and sexed, political/philosophical structures in which they are embedded.

Participating Artists: Lisa Anne Auerbach, John Divola, Jonmarc Edwards, Mark Steven Greenfield, Jim Jenkins, Sherry Karver, Jason Manley, Katja Mater, Anna Mayer, Owen Mundy, Christina Ondrus, Lizabeth Eva Rossof, Cody Trepte, and Penny Young

Curated by James MacDevitt.

-->