Beautiful Data II @ Metalab at Harvard University

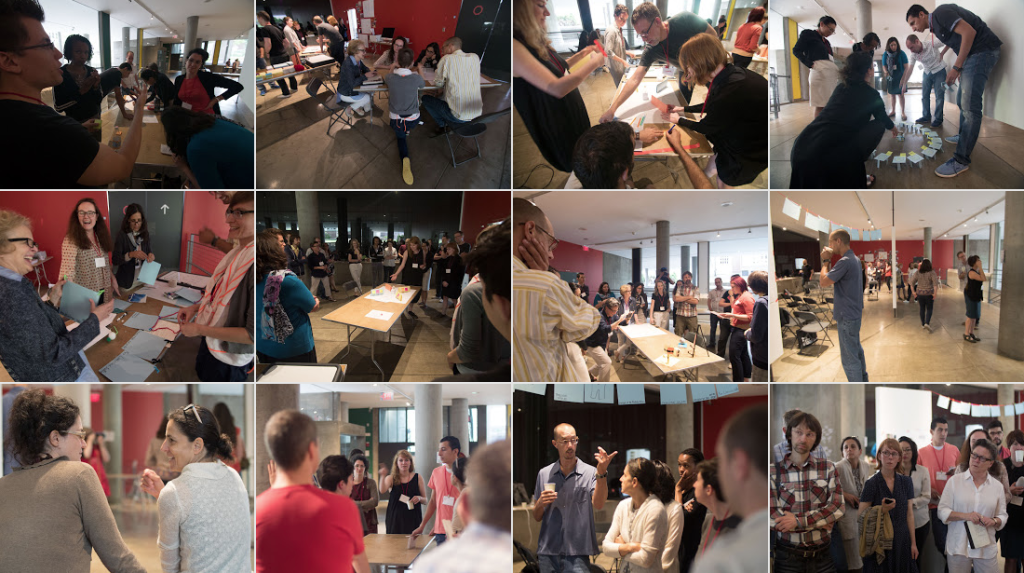
This month found me at the excellent Beautiful Data II workshop at the MetaLab at Harvard University sponsored by the Getty Foundation. Participants worked together in the Carpenter Center and Harvard Art Museum under the theme “Telling Stories About Art with Open Collections.”
Screen Shot 2015-08-01 at 7.03.00 PM

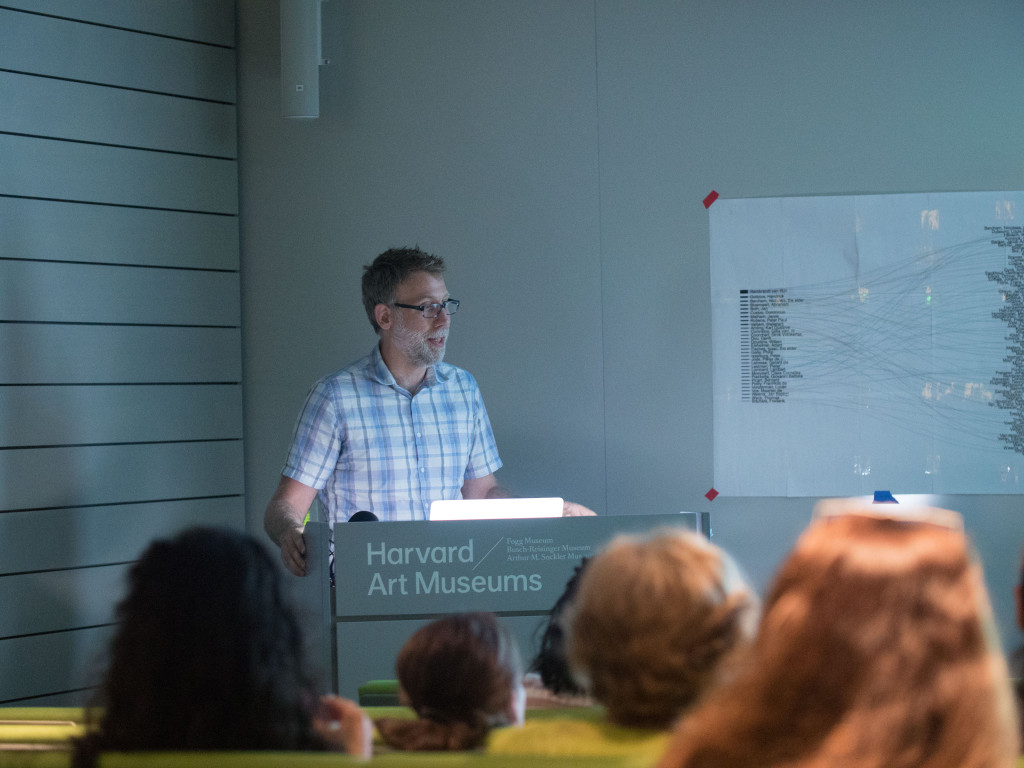
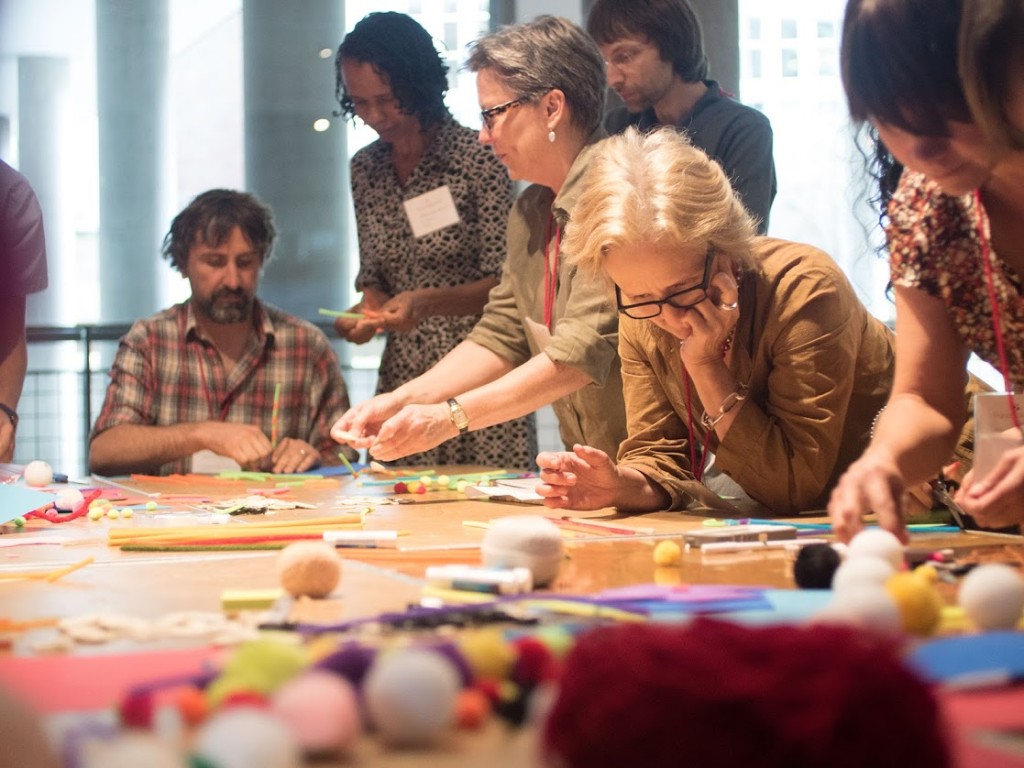
There were presentations by known visualization and museums experts, breakout sessions exploring how to represent problem data and collections, and talks by participants and Metalab staff and fellows, including a wonderful group of artists, curators, designers, and scholars in attendance.

Here are a few of the many highlights starting with this nerdy shot of me…
P1030056

P1000822
Data Therapy workshop with Rahul Bhargava (slides1, slides2).

Screen Shot 2015-08-04 at 8.18.09 PM
Learning about provenance at the Harvard Art Museum (note stamp declaring Nazi property)

This spanking cat statuette from the Cooper Hewitt collection.
Colour Lens produced at Beautiful Data I.
Presentation by Seb Chan Director of Digital at Cooper Hewitt.
Memory Slam by Nick Montfort.
Meow Met Chrome extension shows cats from the Met Museum in new tabs.

IMG_3966
Behind the scenes of Ivan Sigal‘s Karachi Circular Railway, Harvard Art Museum Lightbox.

The Life and Death of Data by Yanni Loukissas.
Ben Rubin discussing his and works by Mario Klingemann, Ryoji Ikeda, Jer Thorp and others.
William James Twitter Bot by Rachel Boyce.


Cold Storage documentary by Jeffrey Schnapp, Cristoforo Magliozzi, Matthew Battles, et al.

Cooper Hewitt Font Specimen
Cooper Hewitt typeface by Chester Jenkins


“Unicode” by Jörg Piringer shows all 49571 displayable characters in the unicode range.

*Most photos by Metalab staff

“Owen Mundy just ruined the Internet” and the last days for the kickstarter

It has been an intense couple weeks since my last post. It turns out the internet loves cats even more than data, maps, and politics. So here is an update on many things “cat”…

Update on the project

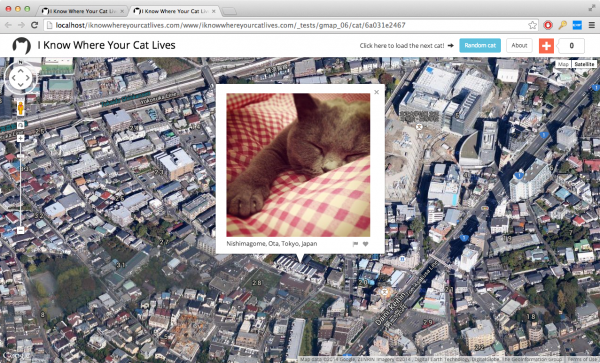
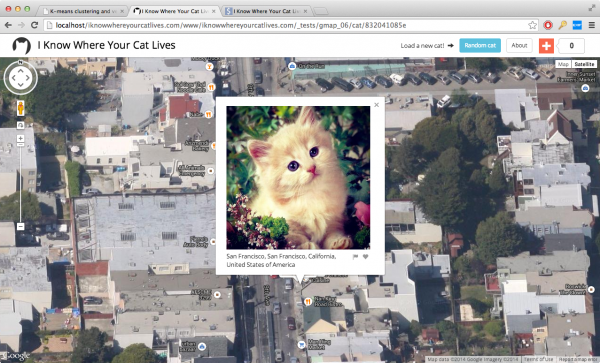
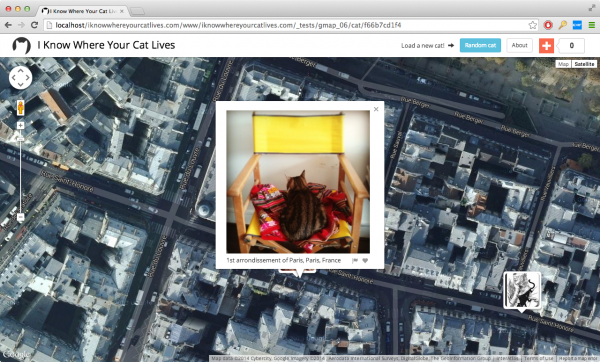
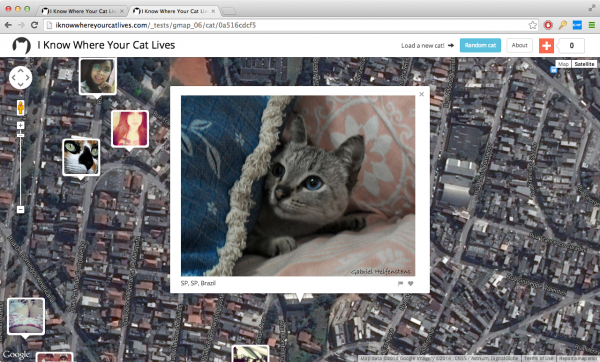
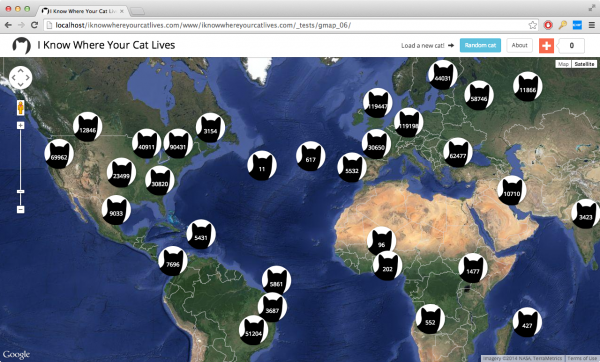
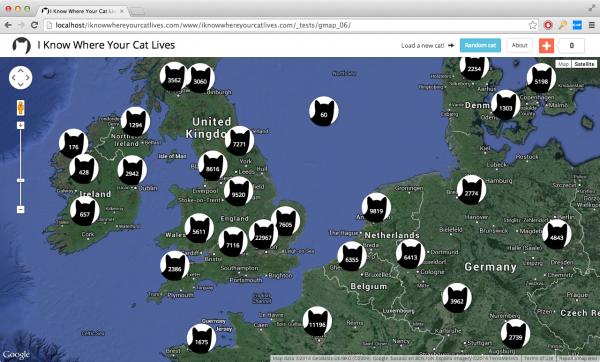
I Know Where Your Cat Lives has received an overwhelmingly positive response from international press. Besides photos of cats on a world map, there are charts, an FAQ and (now) links to press on the website.

I have to admit I specifically picked cat photos as an accessible medium with which to explore the privacy issue. Still, I was astounded at just how much the internet responded. It’s not only cats, the issue was important for discussion, and I appreciated that as well as the thoughtful responses from everyone. Even the puns.


The privacy implications of cat pictures (4:24) MSNBC Interview with Ronan Farrow

Meet The Guy Who’s Putting Your Cat On The Map — To Prove A Point (2:12) Interview with National Public Radio’s All Things Considered

npr_logo

“If you have posted a picture of your cat online, data analyst and artist Owen Mundy, and now, the rest of the world, knows where it lives. And, by that logic, he knows where you live, too. That should probably creep you out a little bit, and that’s really the point.”

Screen Shot 2014-08-06 at 2.53.29 PM

“Using cat pictures — that essential building block of the Internet — and a supercomputer, a Florida State University professor has built a site that shows the locations of the cats (at least at some point in time, given their nature) and, presumably, of their owners.”

Screen Shot 2014-08-06 at 9.41.41 AM

“Attention all 4.9 million users of the #Catstagram hashtag: You’re being watched.”

Screen Shot 2014-08-06 at 2.54.23 PM

“I recognize that a single serving site like this should be easy to quit, but I’ve been refreshing for hours and looking at all the different cats of the world. Near, far, wherever they are, these cats just go on and on and on.”

Screen Shot 2014-08-06 at 9.53.46 AM

“If I put up a “cat” photo on Instagram, I am not just sharing a cat photo on Instagram. I am offering up data about my, and my cat’s, location. “I Know Where Your Cat Lives” is, as a title, meant to be vaguely threatening.”

Screen Shot 2014-08-06 at 9.53.54 AM

“Owen Mundy just ruined the Internet. What were once innocuous photos of grumpy cats, tired cats, and fat cats, have now become adorable symbols of just how little privacy we have online.”

Screen Shot 2014-08-06 at 9.54.06 AM

Some charts

Because, charts.

chart_world

catsworld-citiesworld

chart_eu

chart_AT-DE

Traffic and hosting

So far 19,169 cats have been removed from the map due to privacy settings on their photographs being increased. I think this is awesome. And, it is also the ironic part of this project in that its success is measured in increased privacy. Meaning, the more people who are convinced to manage their data better, the less cats I will be able to represent on the map!

Truthfully speaking, I don’t think I have to worry about running out of cats, since this is a small portion of the total one million. And, I figured out a clever way to show this progress as it unfolds:

Screen Shot 2014-08-06 at 10.46.31 AM

The bandwidth and computing resources consumed by this project have been crazy. Even with a very fast Amazon EC2 server (high I/O computing-intensive 4XL server with 16 virtual cpus and 30 GB RAM) I watched the CPU hover at 100% for the entire day of The New York Times article. And this is after I put many hours indexing the database columns and making the scripts efficient in other ways. All told my bill for “going viral” was $1,019.73 (the month of July 2014).

Screen Shot 2014-07-31 at 10.01.18 AM

I used a few different logging tools to monitor the status of the server. Here are some basic stats (from awstats installed on the server) from the three weeks since I launched the project. This is for the requests and bandwidth on the EC2 server only. It does not include the actual cat photos, only the website itself (html, css, json, php, etc):

  • 353,734 unique visits
  • 14,141,644 pages (total clicks on the site)
  • 16,786,127 requests (additional files)
  • 8846.24 GB bandwidth (again, only text files)

I also used CloudFlare CDN (thanks for the tip Tim Schwartz!) to cache the site files and cat photos and serve the data from various locations around the world. This helped with the speed and to decrease my costs. Since all requests are routed through their DNS I believe their stats are likely the most reliable. According to CloudFlare, they served:

  • 20,631,228 total requests (3,089,020 of which were served through CloudFlare’s cache)
  • 10.2 TB bandwidth!! (437.3 GB of this data (site files and cat photos were served by CloudFlare)

Screen Shot 2014-08-06 at 11.20.28 AM

The Kickstarter has <3 days left!

And great news, thanks to 123 backers, including a big push from the awesome folks at Ghostery and Domi Ventures, the Kickstarter will be funded! There’s still time however, to help contribute to the number of years I can keep the site live while getting fun rewards from the project like I Know Where Your Cat Lives themed beer koozies and plush fish-shaped catnip-laced cat toys, as well as a limited edition signed I Know Where Your Cat Lives archival ink jet print. The kickstarter closes on Sat, Aug 9 2014 11:49 AM EDT.

Thanks again to everyone who supported the project. It’s been fun.


I Know Where Your Cat Lives launched

I just launched a new ongoing project this week. Here’s the text, a video and some screenshots. I’ll post more about how I made it soon.

Welcome to the today’s internet—you can buy anything, every website is tracking your every move, and anywhere you look you find videos and images of cats. Currently, there are 15 million images tagged with the word “cat” on public image hosting sites, and daily thousands more are uploaded from unlimited positions on the globe.

“I Know Where Your Cat Lives” iknowwhereyourcatlives.com is a data experiment that visualizes a sample of 1 million public pics of cats on a world map, locating them by the latitude and longitude coordinates embedded in their metadata. The cats were accessed via publicly available APIs provided by popular photo sharing websites. The photos were then run through various clustering algorithms using a supercomputer at Florida State University in order to represent the enormity of the data source.

This project explores two uses of the internet: the sociable and humorous appreciation of domesticated felines, and the status quo of personal data usage by startups and international megacorps who are riding the wave of decreased privacy for all. This website doesn’t visualize all of the cats on the net, only the ones that allow you to track where their owners have been.

Folks can also contribute to a kickstarter to help with hosting costs.

Screen Shot 2014-05-14 at 11.01.20 PM

Screen Shot 2014-05-14 at 11.06.09 PM

Screen Shot 2014-05-15 at 10.16.42 AM

Screen Shot 2014-05-23 at 8.48.02 PM

Screen Shot 2014-05-23 at 9.24.59 PM

Screen Shot 2014-06-05 at 10.28.53 AM

Screen Shot 2014-06-05 at 10.30.26 AM

Term vs. Term for Digital Public Library of America hackathon

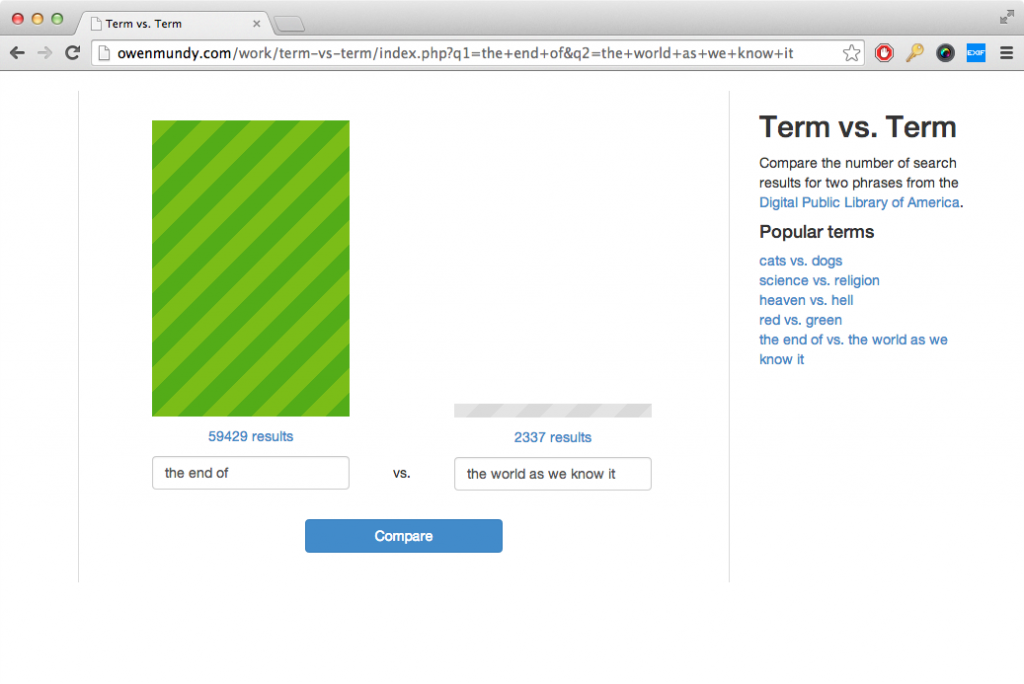
I made a small app to compare the number of search results for two phrases from the Digital Public Library of America for a hackathon / workshop here at Florida State next week.

http://owenmundy.com/work/term-vs-term

dpla term vs term

Digital Humanities Hackathon II – Digital Public Library of America

Monday, April 21, 2:00-3:30 p.m.
Strozier Library, Scholars Commons Instructional Classroom [MAP]

The Digital Scholars Reading and Discussion Group will simulate its second “hackathon” on April 21, allowing participants to learn more about the back-end structure of the Digital Public Library of America. With its April 2013 launch, the DPLA became the first all-digital library that aggregates metadata from collections across the country, making them available from a single point of access. The DPLA describes itself as a freely available, web-based platform for digitized cultural heritage projects as well as a portal that connects students, teachers, scholars, and the public to library resources occurring on other platforms.

From a critical point of view, the DPLA simultaneously relies on and disrupts the principles of location and containment, making its infrastructure somewhat interesting to observe.

In this session, we will visit the DPLA’s Application Programming Interface (API) codex to observe some of the standards that contributed to its construction. We will consider how APIs function, how and why to use them, and who might access their metadata and for what purposes. For those completely unfamiliar with APIs, this session will serve as a useful introduction, as well as a demonstration of why a digital library might also want to serve as an online portal. For those more familiar with APIs, this session will serve as an opportunity to try on different tasks using the metadata that the DPLA aggregates from collections across the country.

At this particular session, we are pleased to be joined by Owen Mundy from FSU Department of Art and Richard Urban from FSU College of Communication and Information, who have considered different aspects of working with APIs for projects such as the DPLA, including visualization and graphics scripting, and developing collections dashboards.

As before, the session is designed with a low barrier of entry in mind, so participants should not worry if they do not have programming expertise or are still learning the vocabulary associated with open-source projects. We come together to learn together, and all levels of skill are accommodated, as are all attitudes and leanings.

Participants are encouraged to explore the Digital Public Library of America site prior to our meeting and to familiarize themselves with the history of the project. Laptops will be available for checkout, but attendees are encouraged to bring their own.

After Douglas Davis – The World’s First Collaborative Sentence

Screen Shot 2013-09-05 at 3.21.58 PM

README for After Douglas Davis
==============================

Statement
————–

The World’s First Collaborative Sentence was created by Douglas Davis in 1994 and donated to the Whitney Museum of American Art in 1995. Much like today’s blog environments and methods for crowdsourcing knowledge, it allowed users to contribute practically any text or markup to a never-ending sentence with no limits on speech or length.

At some point the sentence stopped functioning, and in early 2012 the Whitney Museum undertook a “preservation effort” to repair and relaunch the project. Measures were taken during the “restoration” to stay true to the original intent of the artist, leaving dead links and the original code in place.

During the preservation the curators placed small sections of garbled ASCII text from the project on Github with the hope that others would “fork” the data and repair the original. However, the Whitney Museum did not succeed in realizing that the collaborative culture of the net Davis predicted has actually arrived. This is evident not only through sites like Wikipedia, Facebook, and Tumblr, but the open source movement, which brings us Linux, Apache, and PHP, the very technologies used to view this page, as well as others like Firefox, Arduino, Processing, and many more.

In the spirit of open source software and artists like Duchamp, Levine, runme.org and Mandiberg, on September 5, 2013, I “forked” Douglas Davis’ Collaborative Sentence by downloading all pages and constructing from scratch the functional code which drives the project. I have now placed this work on Github with the following changes:

1. All pages are updated to HTML5 and UTF-8 character encoding
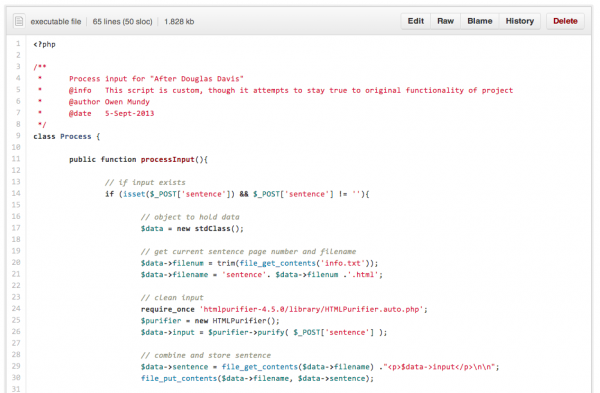
2. The functional code was rewritten from scratch including a script to remove malicious code
3. The addition of this statement

I was originally disappointed the Whitney Museum didn’t place the full source code in the public domain. What better way to make it possible for artists and programmers to extend the life of Davis’ project by learning from, reusing, and improving the original code than to open source this work? Though, possibly like Davis, my motivation is largely in part an interest in constructing a space for dialog, framing distinct questions and new possibilities, and waiting to see what happens from this gesture.

Included software
————–
HTML Purifier http://htmlpurifier.org/

Live version
————–
Enter After Douglas Davis

About the author
————–
Owen Mundy http://owenmundy.com/

Washington Post review of “Grid, Sequence Me” show + documentation

washingtonpost

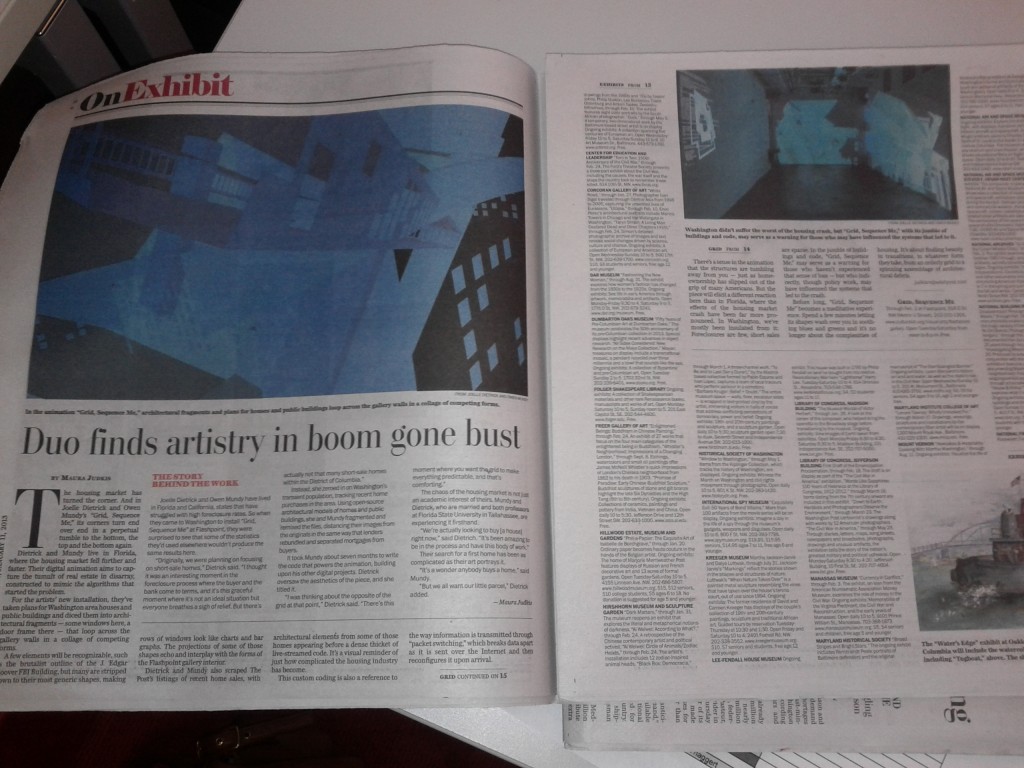
The Washington Post recently published a review recently about my and Joelle’s exhibition at Flashpoint Gallery in D.C. Check it out: Joelle Dietrick & Owen Mundy: Grid, Sequence Me, by Maura Judkis, Jan 11, 2013.

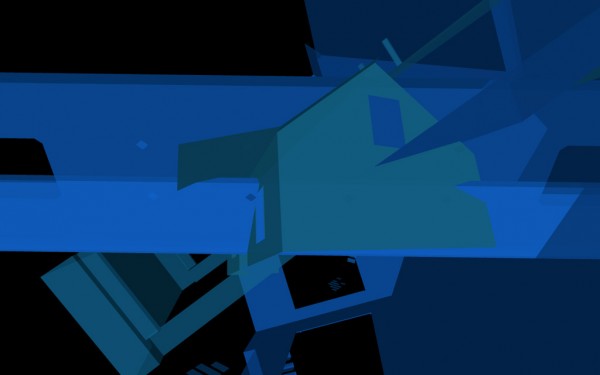
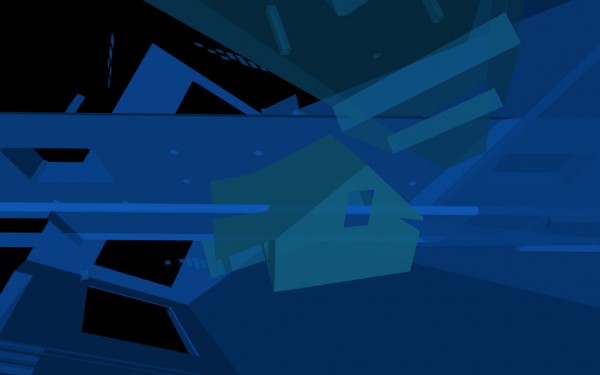
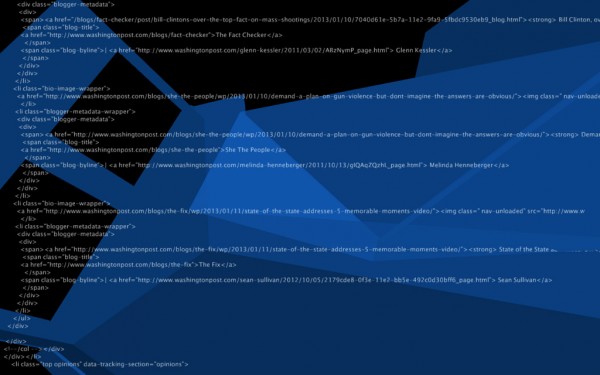
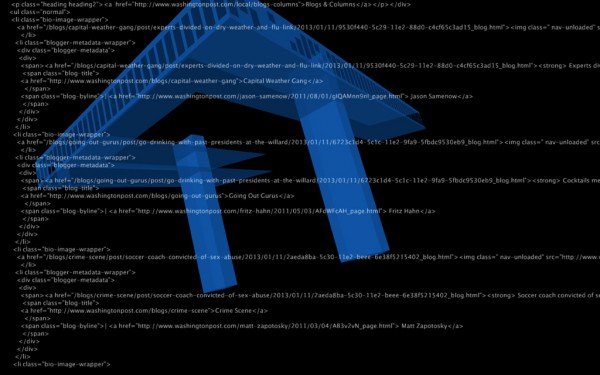
A few elements will be recognizable, such as the brutalist outline of the J. Edgar Hoover FBI Building, but many are stripped down to their most generic shapes, making rows of windows look like charts and bar graphs. The projections of some of those shapes echo and interplay with the forms of the Flashpoint gallery interior.

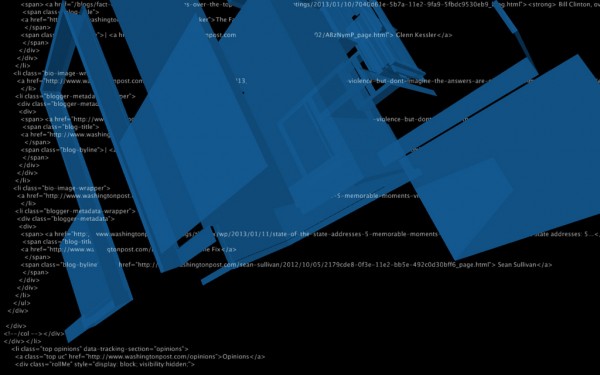
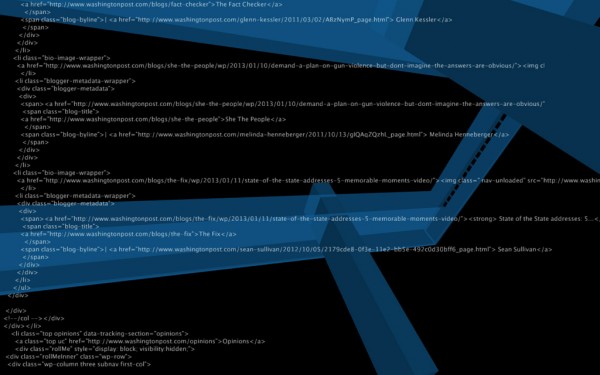
Dietrick and Mundy also scraped The Post’s listings of recent home sales, with architectural elements from some of those homes appearing before a dense thicket of live-streamed code. It’s a visual reminder of just how complicated the housing industry has become.

There’s a sense in the animation that the structures are tumbling away from you — just as homeownership has slipped out of the grip of many Americans. But the piece will elicit a different reaction here than in Florida, where the effects of the housing market crash have been far more pronounced. In Washington, we’ve mostly been insulated from it: Foreclosures are few, short sales are sparse. In the jumble of buildings and code, “Grid, Sequence Me,” may serve as a warning for those who haven’t experienced that sense of loss — but who indirectly, though policy work, may have influenced the systems that led to the crash.

I also finished a short piece with video from the installation and screen captures of the Processing visualization.

Grid, Sequence Me @ Flashpoint Gallery, Washington D.C.

2013_grid_11_1024w

Surrounded by images of cross-sectioned buildings and source code excerpts, gallery visitors encounter fragments of Washington, DC architecture—a vaguely familiar roofline or grid of office windows—remixed with data and source code representing the latest housing sales in the area. Constantly changing, the live data streams into the gallery from both local sources (DC short sale listings) and national (federal policy sites), emphasizing the effects of related micro-macro shifts.

2013_grid_screen_10_1024w

2013_grid_screen_09_1024w

Generated with custom software, these fragments echo financial systems and housing market fluctuations. They mirror mortgages repackaged and sold, titles lost in administrative tape, and dreams confused by legal jargon. Like the complex financial systems of the housing market heyday, the software generates an infinite number of arrangements. The complexity of unique and dynamically-created algorithmic outcomes contrasts with the comforting predictability referenced in the exhibition’s title, “Grid, Sequence Me.”

—Joelle Dietrick and Owen Mundy

2013_grid_01_1024w

2013_sea_screen_23_1024w

2013_sea_screen_20_1024w

2013_sea_screen_13_1024w

2013_sea_screen_06_1024w

Packet Switching project: ColladaFragmenter software, Kassel, Germany and University of Florida Public Commission

Joelle Dietrick and I embarked on a new body of work this summer called “Packet Switching.” Inspired by her Sherwin Series images and wall paintings, and my work deconstructing and re-visualizing source code and other data, we’ve created two new software projects, as well as a series of limited edition prints, large photo installations, wall-sized paintings, and animations.

The full statement explains our process and intent clearly:

Packet Switching is an ongoing body of work by Joelle Dietrick and Owen Mundy that visualizes architecture as fragments affected by economic and communications systems.

The title of the series references how contemporary communications systems break digital files into smaller manageable blocks of data called packets. Each packet is then sent through a network, taking the quickest route possible, and reassembled once they reach their destination. One JPG image, for example, might be broken into several packets, each of which may travel a different path through the net, even through different cities, before being recompiled into a copy of the original file.

To reference this common process used in networked systems, we wrote custom software that deconstructs a 3D model’s source code and produces unique fragments. We further remixed these fragments using an original application created in Processing. The resulting images become limited edition prints, large photo installations, wall-sized paintings, and animations.

Our process underscores how incidental fragmentation and automation can streamline markets, but also make them vulnerable to systems failure. The use of architecture specifically points to recent real estate market volatility and considers how communication technology-enabled pursuits of profit margins alters our most basic needs.

The first software, that “deconstructs a 3D model’s source code and produces unique fragments,” is open source and available on Github. Essentially, the PHP software, parses a 3D COLLADA file and exports a set number of geometries, that can then be further broken down and used in an artwork or design.

The second software, which we will release soon, remixes these fragments using Processing. The video below shows an example of the whole process.

Wall painting at “Temporary Home” in Kassel, Germany

While artists-in-residence at Temporary Home, in Kassel, Germany, which coincided with Documenta13, Joelle Dietrick and I completed a wall-sized temporary painting based on the architecture from the Bauhaus School at Dessau and 2012 American color forecasts.

Commission at Weimer Hall at the University of Florida

Joelle and I have also received a commission to complete Packet Switching (Weimer Hall) at the University of Florida College of Journalism and Communications this fall. This will be inkjet on adhesive polyester on a large wall (approx. 177.5 ft. x 20.2 ft.). More details soon.

-->